UPDATE: Bank P/TBV & ROTCE Scatter
The small cap & Trump bump lifted bank valuations; do you know who is rich & who is cheap in bank land? Now you will.
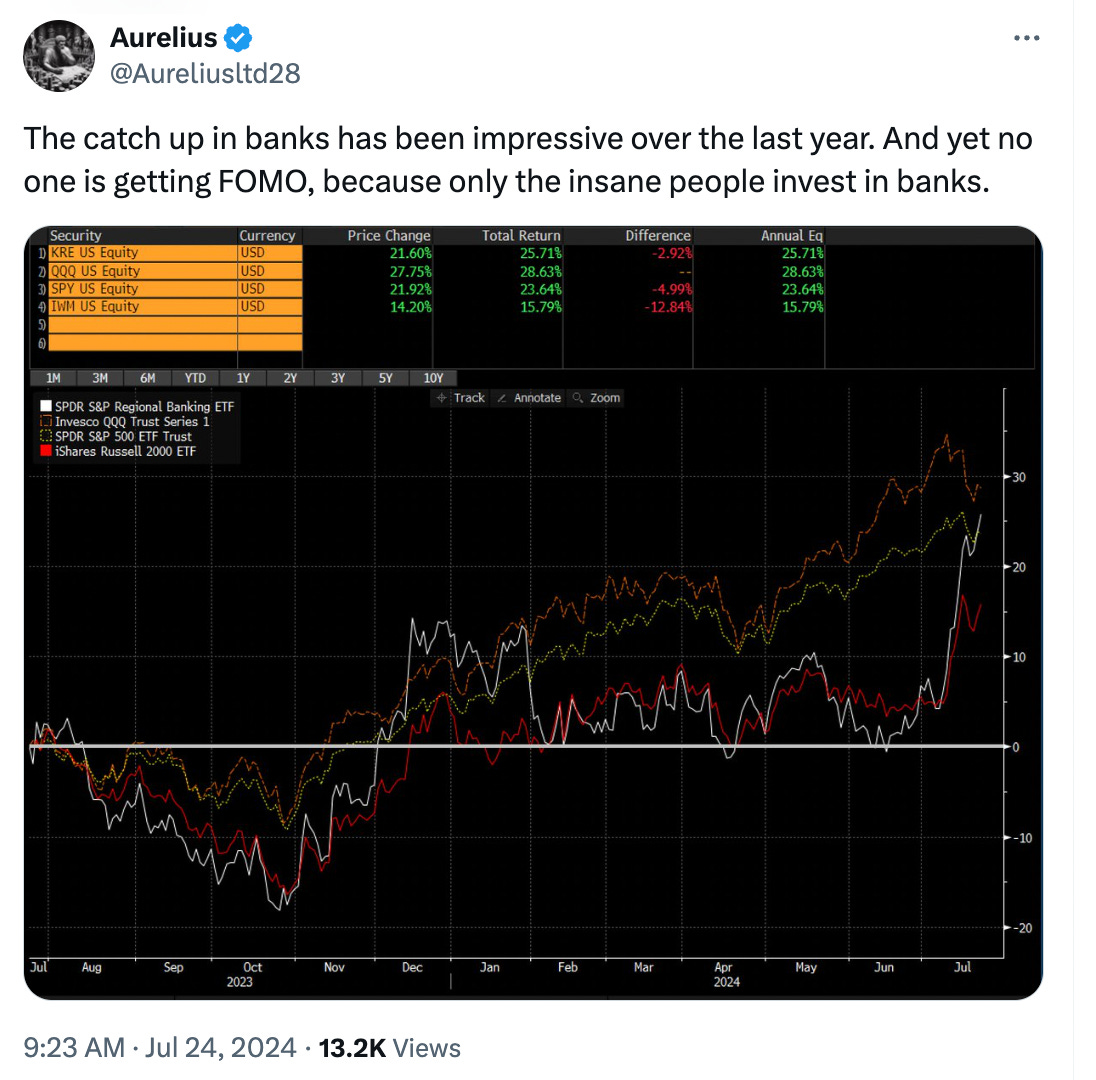
Bank investors everywhere are LOVING the rally here.
But it just got a little bit harder to determine what you should pay for a certain bank.
The updated P/TBV & ROTCE scatter is here to help.
Why Is ROTCE Important?
It’s pretty simple.
Shows true earning power: ROTCE cuts through the accounting nonsense and tells you what the bank's really earning on its core equity. Income into equity, the simplest & powerful metric there is.
Comparability: It levels the playing field. Different banks, different balance sheets, but ROTCE lets you compare apples to apples. Banks can be very different in business model or balance sheet, but ROTCE is universal.
Capital allocation litmus test: High ROTCE? Management's likely allocating capital decently. Low ROTCE? They're probably pissing money away. Somewhere in between? There’s probably a reason why.
Why Is P/TBV important?
Also, pretty simple.
Margin of safety gauge: P/TBV tells you how much you're paying above the bank's liquidation value. Pay too much, and you're asking to get your head handed to you when things go south.
Quality indicator: Banks consistently trading above book value? The market's saying they're worth more alive than dead. Below book? Either it's a screaming bargain or a steaming pile. Your job is to figure out which.
Cyclical detector: Banking's a cyclical business, which most of you know. P/TBV fluctuates with the cycle. Low across the sector? Might be time to get greedy when others are fearful. High everywhere? Maybe it's time to take some chips off the table.
Why Is the P/TBV & ROTCE Correlation Important?
Correlation does NOT equal causation, but this framework (other than my RGS) is one of the more important bank investing frameworks.
This is because:
It's a built-in BS detector: Strong correlation means the market's functioning semi-rationally. No correlation? Either you've found a goldmine of mispricing, or you're missing something big.
Tells you where to dig: High ROTCE, low P/TBV? That's where you start looking for hidden gems. But don't get excited yet - could be fool's gold. Low ROTCE, high P/TBV? Someone's probably selling you a fairy tale.
Keeps you honest: You think you've found a bargain? This correlation is the cold shower you need. Forces you to ask: "Am I really smarter than everyone else, or am I just being a damn fool?" Usually, it's the latter for me.
But Banks Have Ripped?
You’re not sleeping under a rock, so you know this. Because only us crazy people invest in banks.
But this run up means that any analysis of the correlation between the two is stale.
So, I updated it for everyone.
7-24-24 P/TBV & ROTCE Scatter Notes
This is for all banks with ‘25 estimates for EPS & TBVPS.
Estimates are as of June (will require another refresh once we clear earnings).
Estimates on EPS do not include potential tax cuts (duh).
Future ROTCE is molded by a lot of factors including but not limited to: CRE concentrations, current Cost of Funds, asset liability profile, tax rate, growth projections for assets & liabilities, tax rates, operating expense projections, provisions & NCOs, capital return projections, & management capital allocation skills.
I added the Relative Growth Score, which is my proprietary screen for determining who has been able to grow revenue per share, earnings per share, and tangible book value per share over time in excess of their peers. This framework is one of the strongest long-term indicators of a bank’s ability to produce shareholder returns. I looked back over the past 7 years and tried to capture (rear view mirror) whose rubber has met the road when it comes to producing the things that drive returns.
This screen led me to both Citibank (RGS was terrible but was too cheap + a “clean up” narrative that would temporarily grow EPS) and Western Alliance (historically strong top 100 grower trading a huge fundamental discount) this year. Two mega performers.
The red & green fields are 25th percentile highs and lows in select categories.
N/A is RGS meant it didn’t have 7 years’ worth of data on RPS, EPS, and TBVPS. Smaller cap banks are sometimes tough.
To catch up on this framework see here:
All combined, this framework is how I orient to:
Who is too expensive for the ROTCE they’re projecting in ‘25?
Who is too cheap for the ROTCE they’re projecting in ‘25?
Who has a “one off” story that requires more analysis?
What’s “fairly priced” in the bank space today?
What high growth score banks are on sale today?
And then obviously long & short ideas come out of reviewing the data. I hope this helps you as well, I think it will.
Keep reading with a 7-day free trial
Subscribe to Victaurs to keep reading this post and get 7 days of free access to the full post archives.


