


This Week In Banks
September Bank Update, Life After Cuts, TBV Accretion Names, & The Biggest Winners & Losers from Rates Up 400 ...

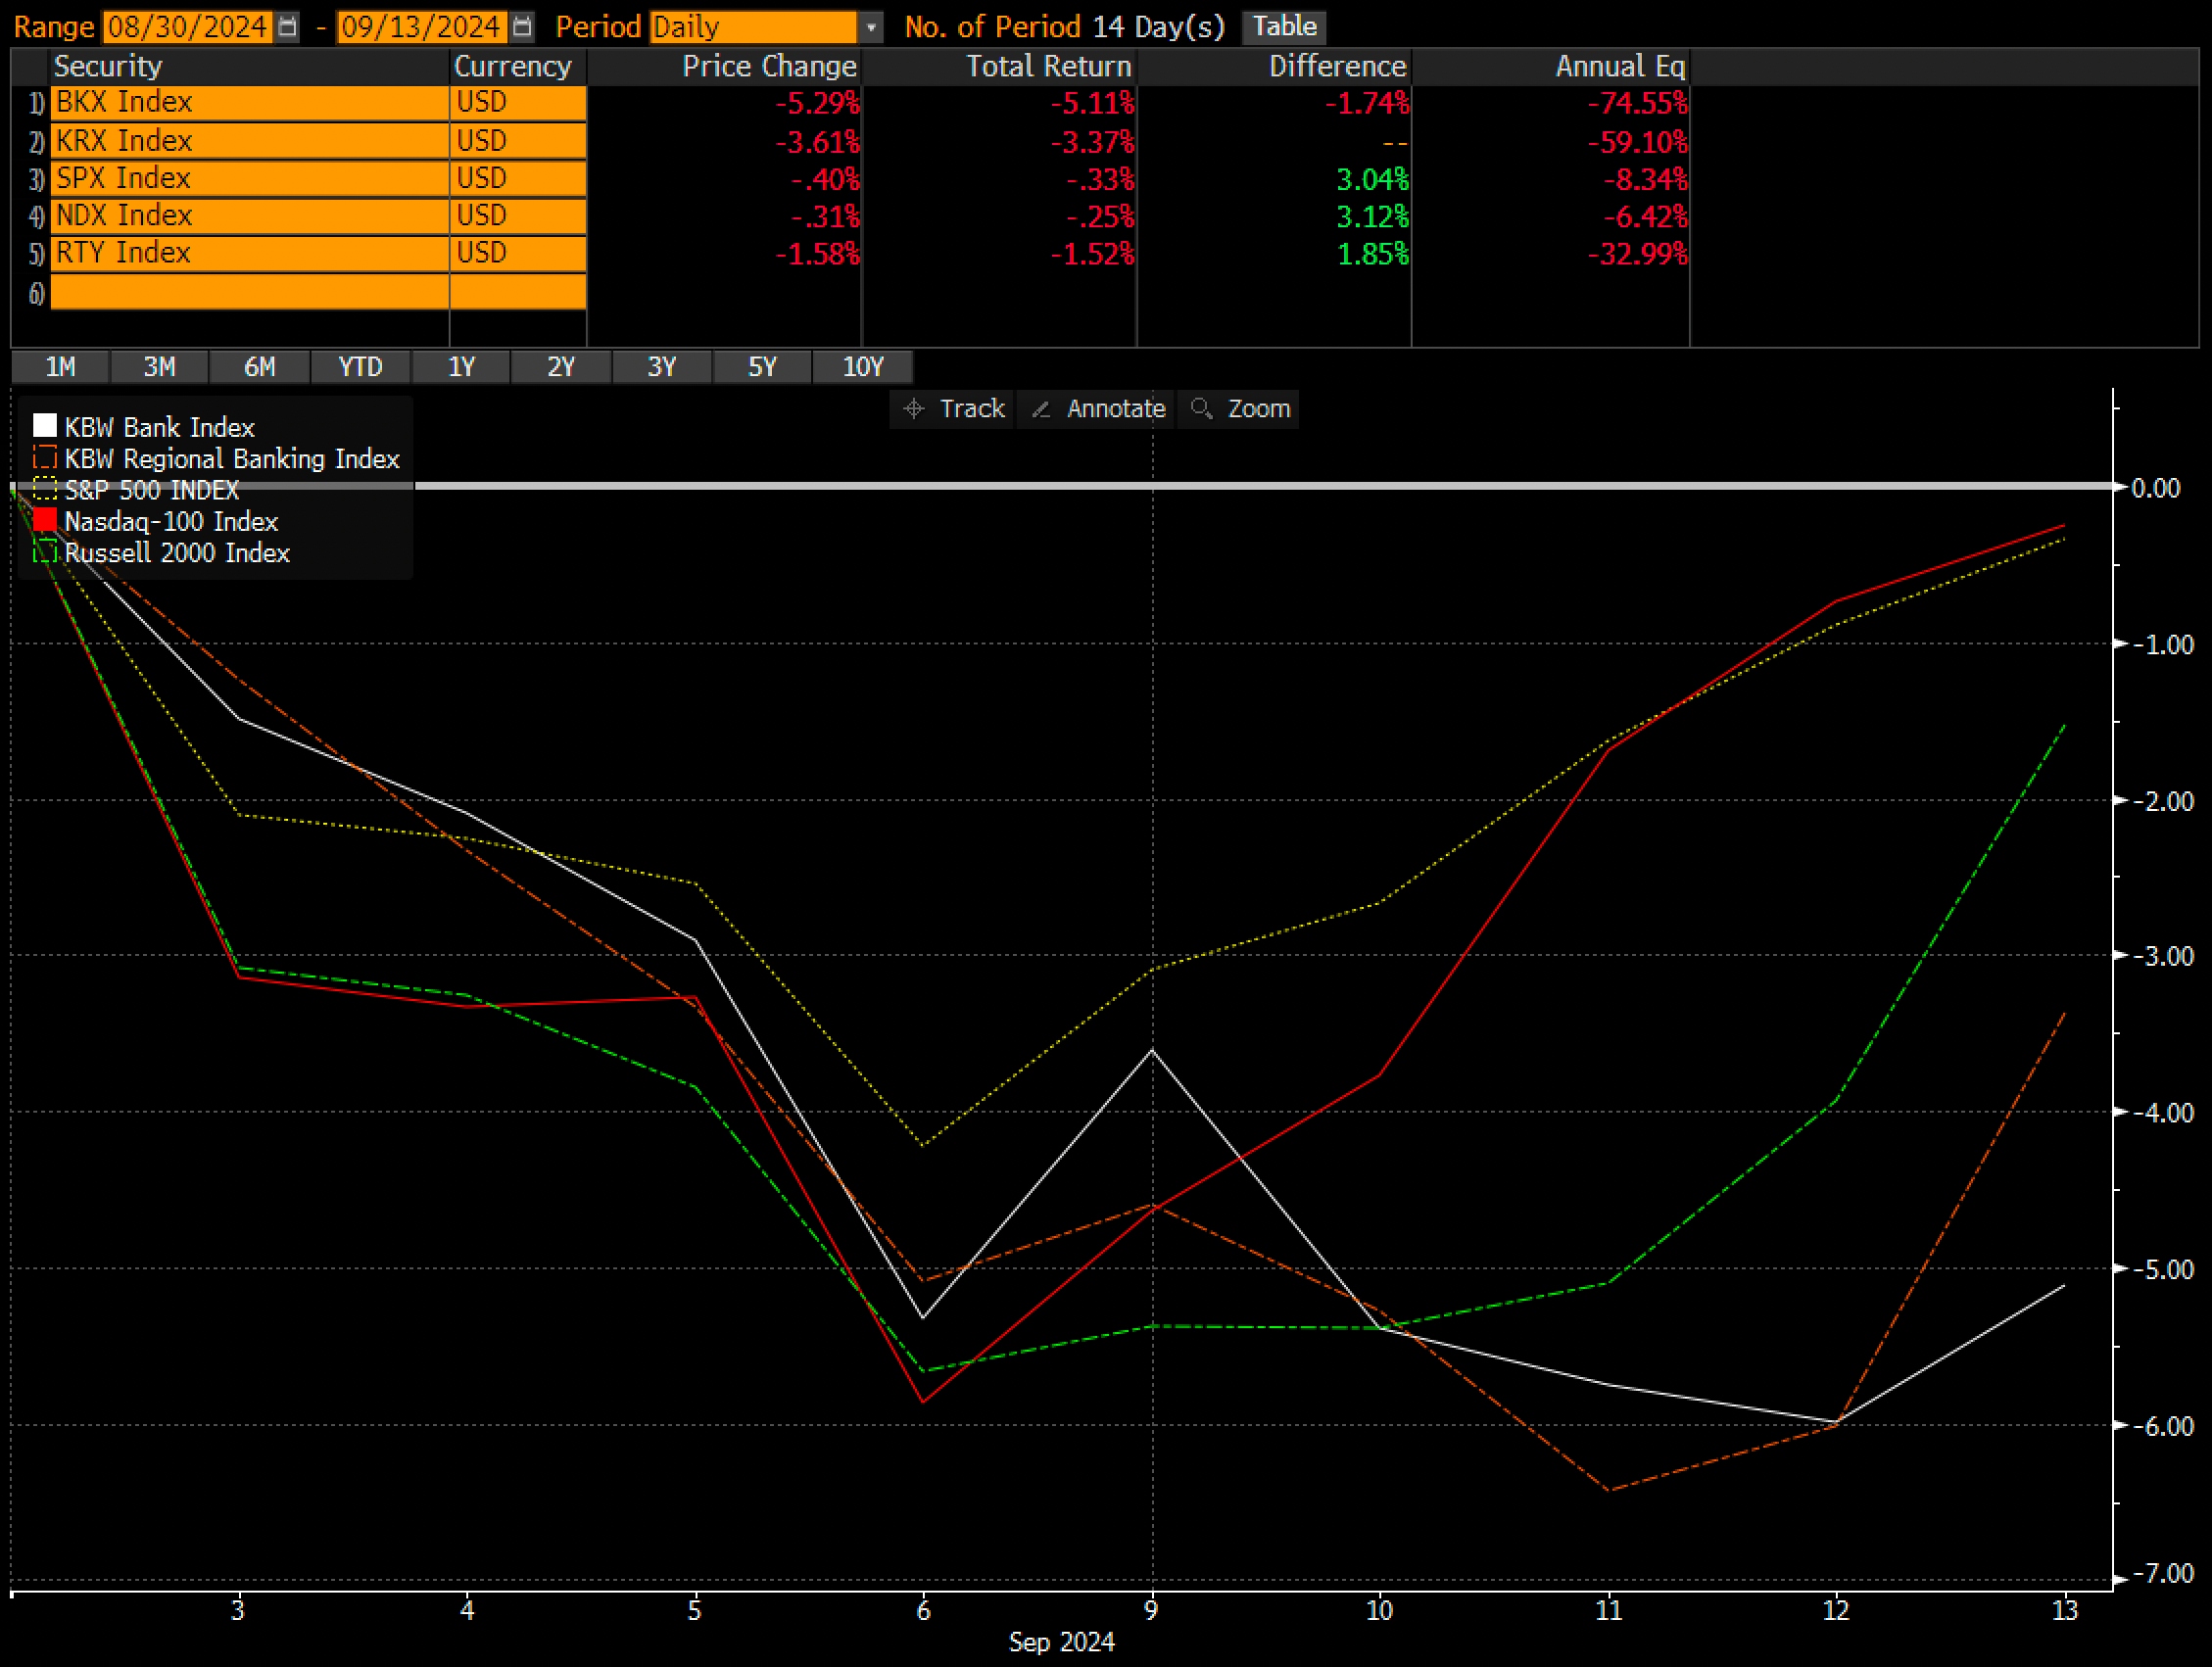
Banks Month to Date
The month to date returns across the market paints a clear picture of sector divergence. Banking stocks took a beating, with the BKX Index down 5.29% and the KRX Index falling 3.61%. In stark contrast, the broader market showed resilience. The SPX dipped a modest 0.40%, while tech stocks, represented by the NDX, fared better with just a 0.31% decline. The RTY Index sat just between these extremes, down 1.58%. A Doomer might say, banking stocks plummeted while other indices recovered.
The Consumer is Dead, Long Live the Consumer.
Recent reports from major financial institutions painted a concerning picture of consumer credit health. Ally Financials CFO Russ Hutchinson revealed unexpectedly high late payments and charge-offs on auto loans, triggering an 18% drop in the company's stock. Citigroup's CFO Mark Mason noted an uptick in delinquencies and a rise in consumers carrying balances. Bread Financial came out and said they anticipate elevated charge-off rates to persist through 2024, while Synchrony Financial reported charge-off rates exceeding pre-pandemic levels and a decline in big-ticket purchases. It would make sense then that the consumer heavy bigger banks got hit worse as a result of the shaky consumer news even though many of them just got done reporting “peak NCOs” in their consumer books. But it’s worth noting, for the most part much of the commentary was related to the lower income households.
Someone is going to need to fact check me, but what I was able to find online about consumer spending was enlightening. According to Statista:
Lower income households (roughly bottom 20-25%) typically account for about 8-10% of total consumer spending.
Middle income households (around 40-60th percentile) usually represents about 15-20% of total consumer spending.
Upper-middle income households (around 60-80th percentile) account for approximately 20-25% of consumer spending.
Highest income households (top 20%) responsible for about 38-40% of total consumer spending.
And with companies like Ferrari and Restoration Hardware continuing to report strong earnings, it does feel like a tale of two consumers. As long as the top end feels good about life, the US Economy should continue rolling. I have no crystal ball, but it’s hard to see a massive recession on the horizon. That plus the fact that once the election works itself out, the fiscal stimulus machine will turn back on regardless of who is in power.
A Texas Sized Move
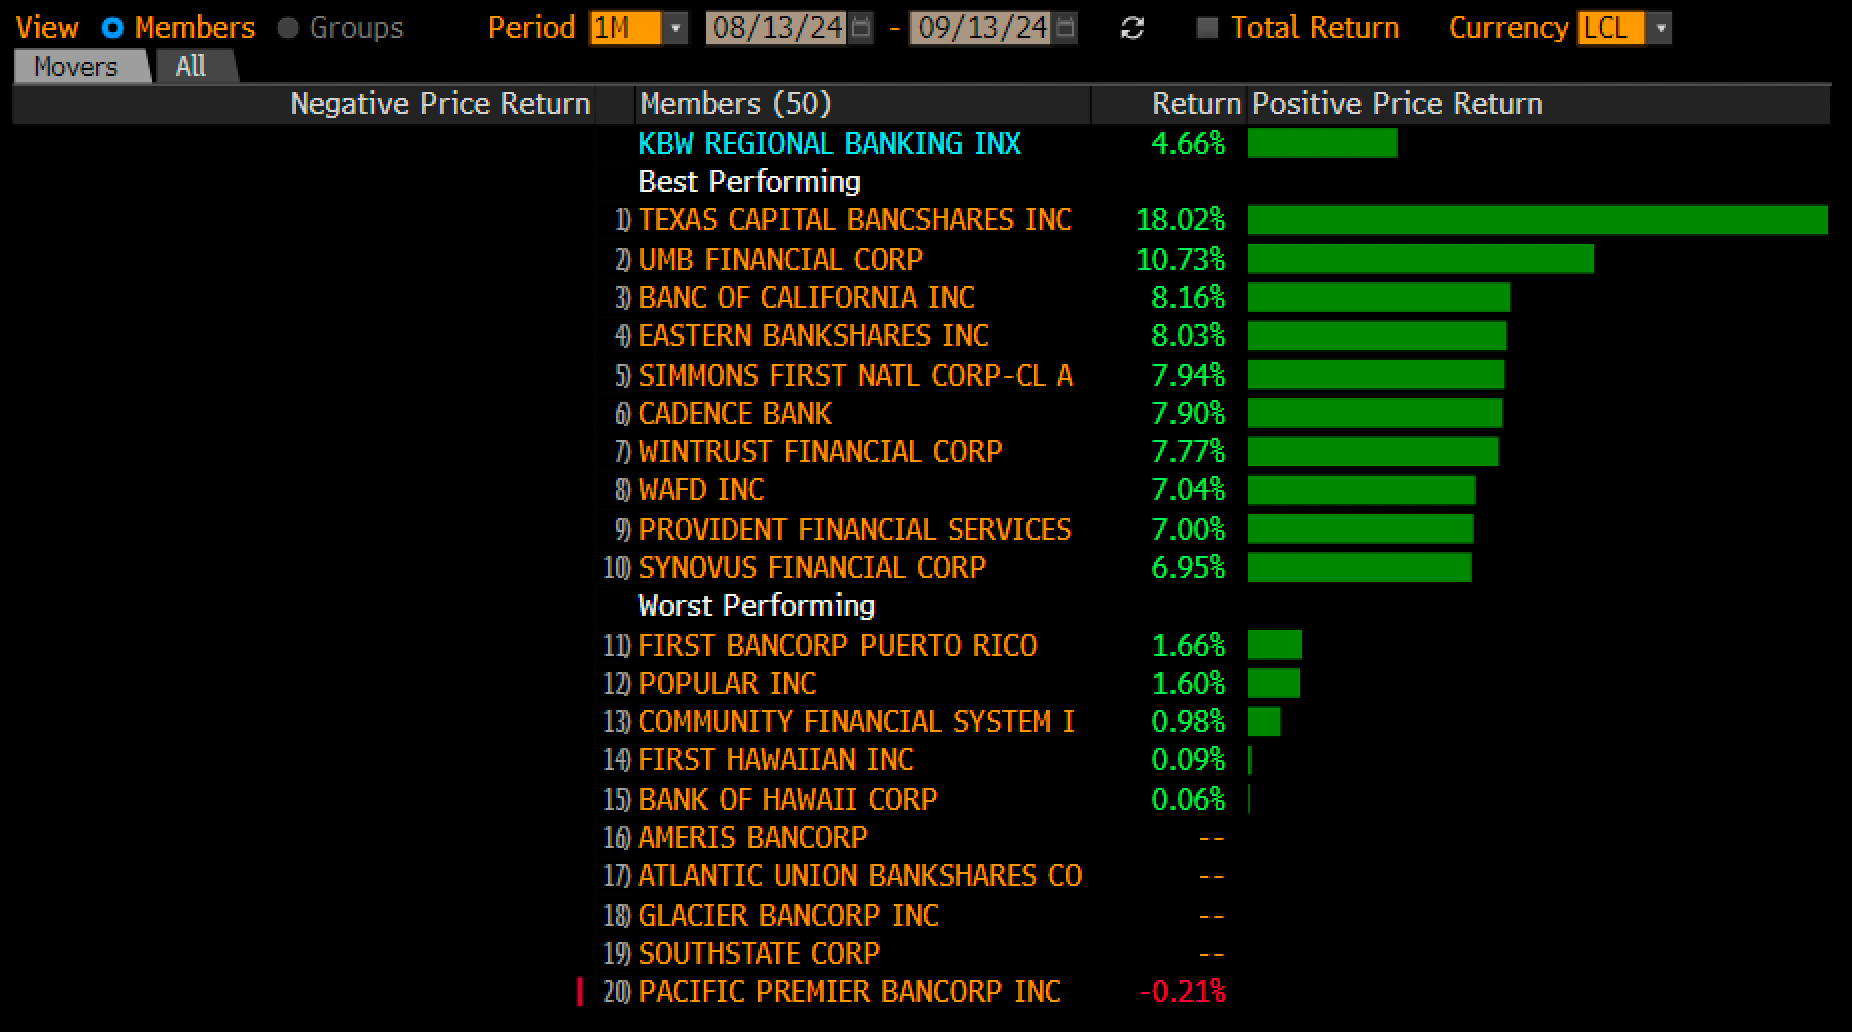
TCBI leads the KRX month to date up 18%. I guess they really embraced the “everything is bigger in Texas” argument when they announced several strategic actions to progress towards its performance targets. The company is acquiring a $400 million healthcare sector portfolio and has sold $1.24 billion of low-yield securities (1.23% yield) to purchase $1.06 billion of higher-yield securities (5.26% yield), expected to generate an additional $35-$40 million in annual net interest income. This repositioning resulted in a $139 million after-tax loss but is anticipated to improve profitability from Q4 2024. Remember this doesn’t touch TCE but does impact regulatory capital. The firm is implementing operational efficiencies expected to reduce 2025 non-interest expenses by $30 million. Texas Capital is also expanding its services by launching an Energy Equity Research team and a Direct Lending platform, focusing on middle market companies. These actions aim to enhance the company's capabilities, improve financial performance, and better serve its clients across various sectors. Estimates should start ticking up in the coming weeks/months & I think next year should now fall into the mid $4s and almost catch $5 by 2026 assuming there’s no major recession. For me they’re expensive, 15x forwards? I will pass.
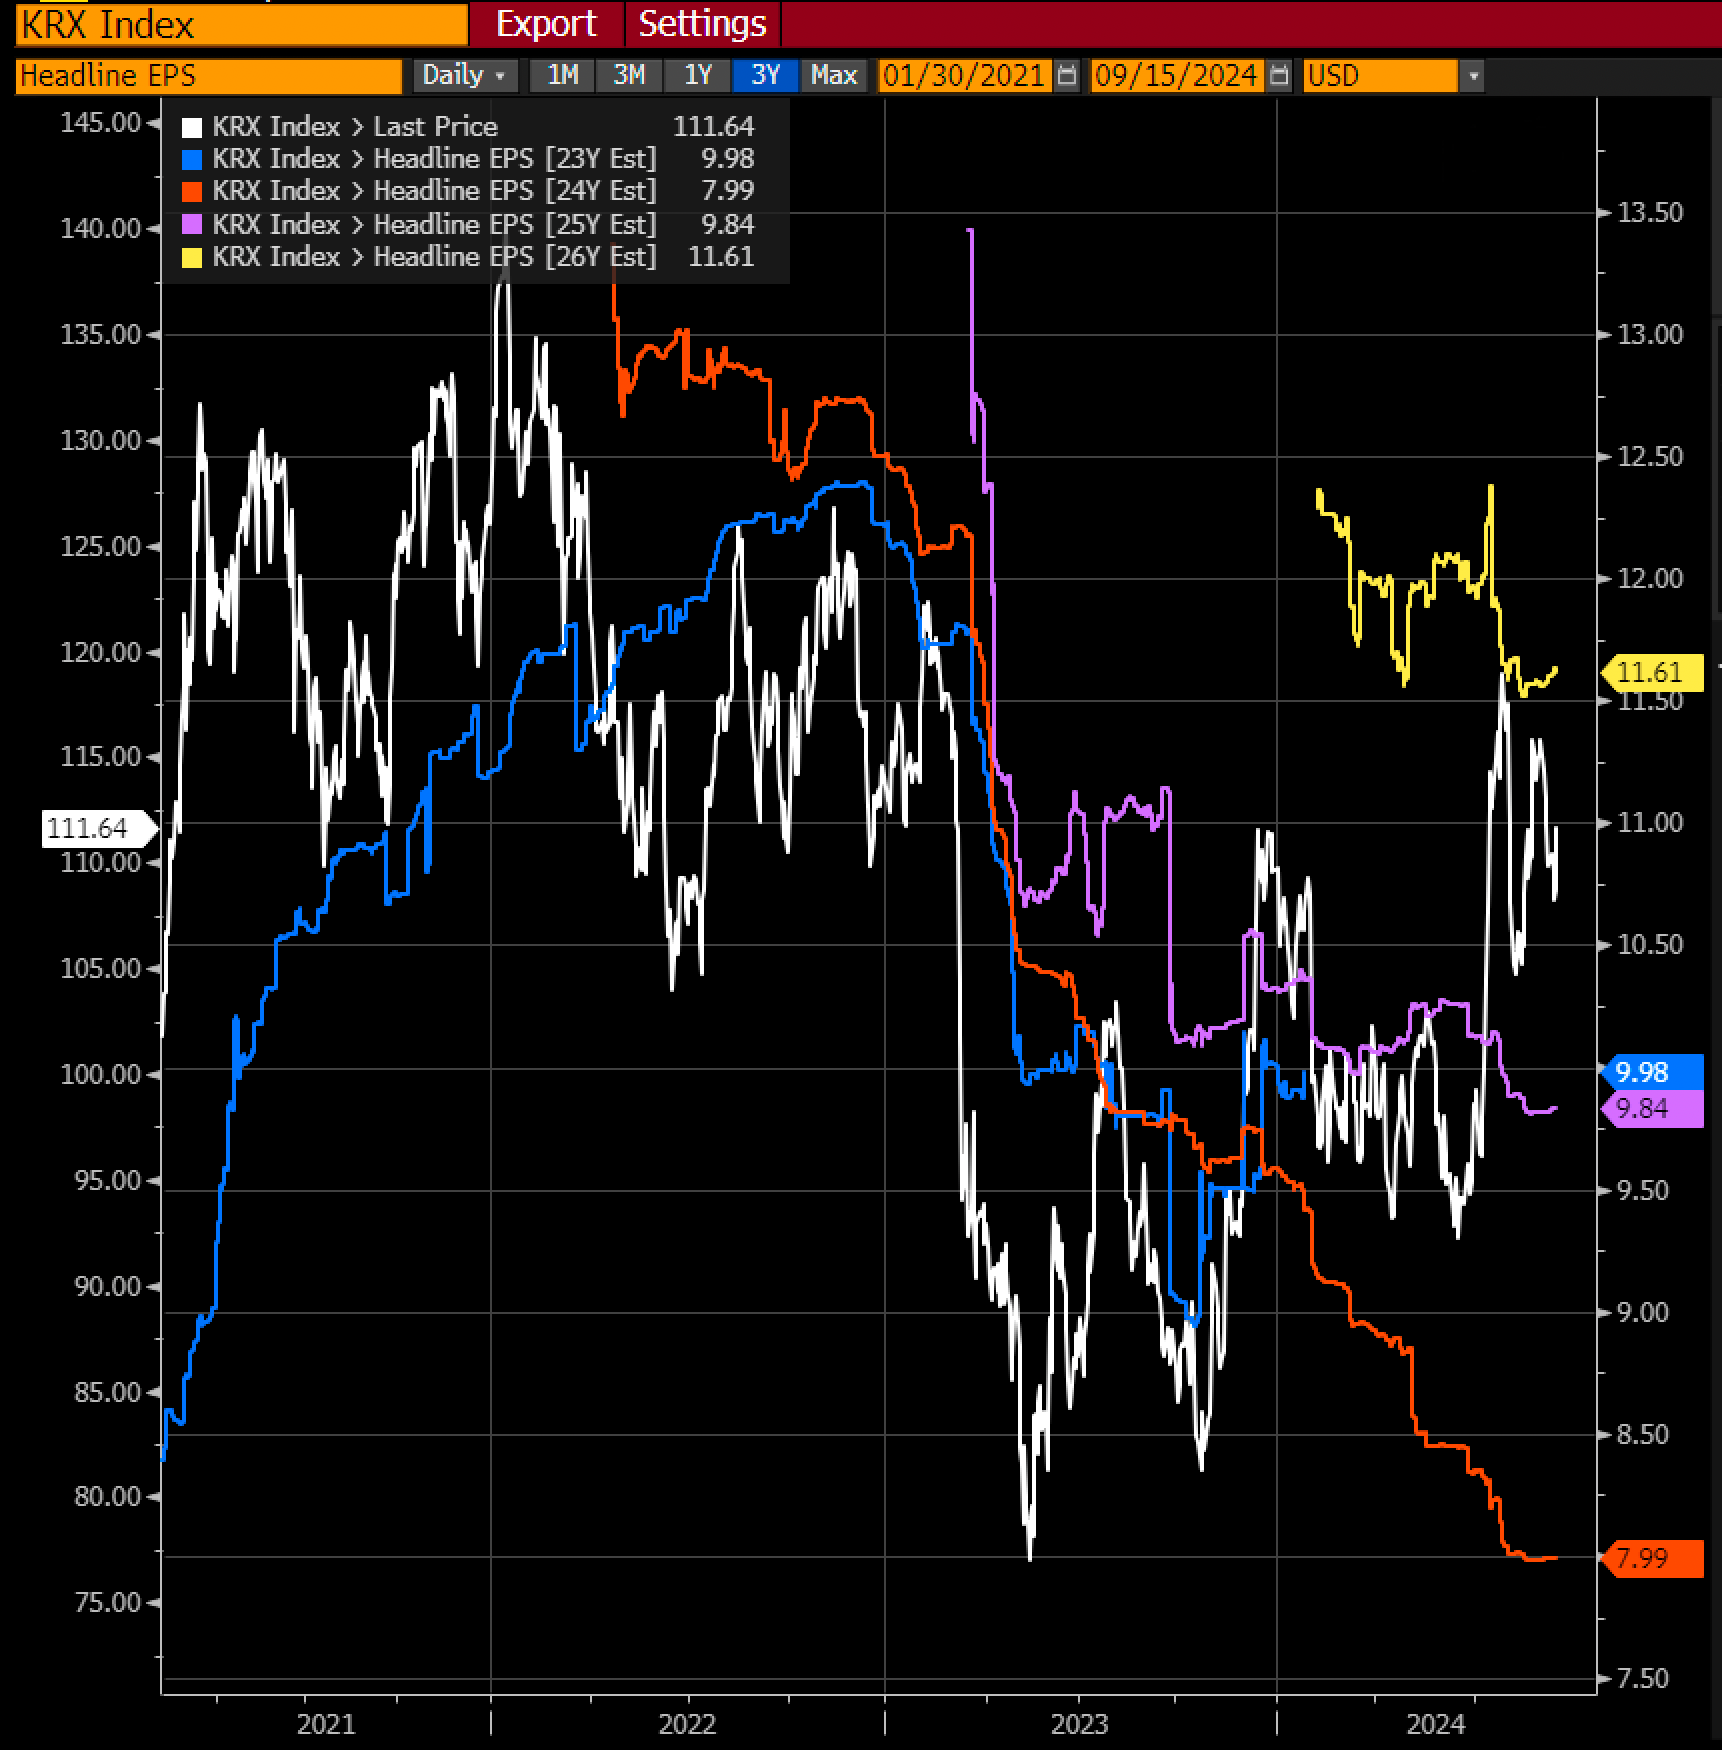
Regional Banks and Earnings Growth?
While everyone has been caught up in Semiconductor mania with OpenAI raising money at a $150 billion valuation and with Jensen selling $100mm in stock almost daily (good for you Jensen) the majority of the world is blissfully unaware that Regional Banks expressed via KRX is set to see about 15% to 20% in EPS growth next year and similar in ‘26. Much like the Chicago Cubs for 107 years before their World Series win in 2016, “next year is our year” for banks. And this becomes more compelling in a world where mega caps are actually slowing into a 15% to 20% EPS year in 2025. I wonder if the hedgie KRX shorts know this is coming?
The First Cut Is the Deepest?
And why the tailwinds for banks?
Rate cuts. Which will mean NIM expansion.
Looking back historically, I’m less concerned with the “performance” of indexes because past does not equal present for a whole host of reasons. But I did want to look back at the average number of cuts and length of cutting cycles. If you count every one of these episodes as unique here is the number of cuts we got in each “cycle” and roughly how long the easing cycle lasted:
1995-1996: 3 cuts over about 6 months
1998: 3 cuts over about 3 months
2001-2003: 13 cuts over about 30 months
2007-2008: 10 cuts over about 15 months
2019-2020: 5 cuts over about 8 months
And taking the “average” of all cutting cycles gives us about 6 or 7 cuts per cycle and roughly 12 months of easing. But extracting the deep bubble burst cycles of 2001-2003 and 2007-2008 the “average” is closer to 3 or 4 cuts over about 6 months. So, I personally am being very careful not to bias myself looking to the past for information. More than ever the Fed is “data dependent” and more than ever the economy, inflation, employment, and interest rate environment are less predictable.
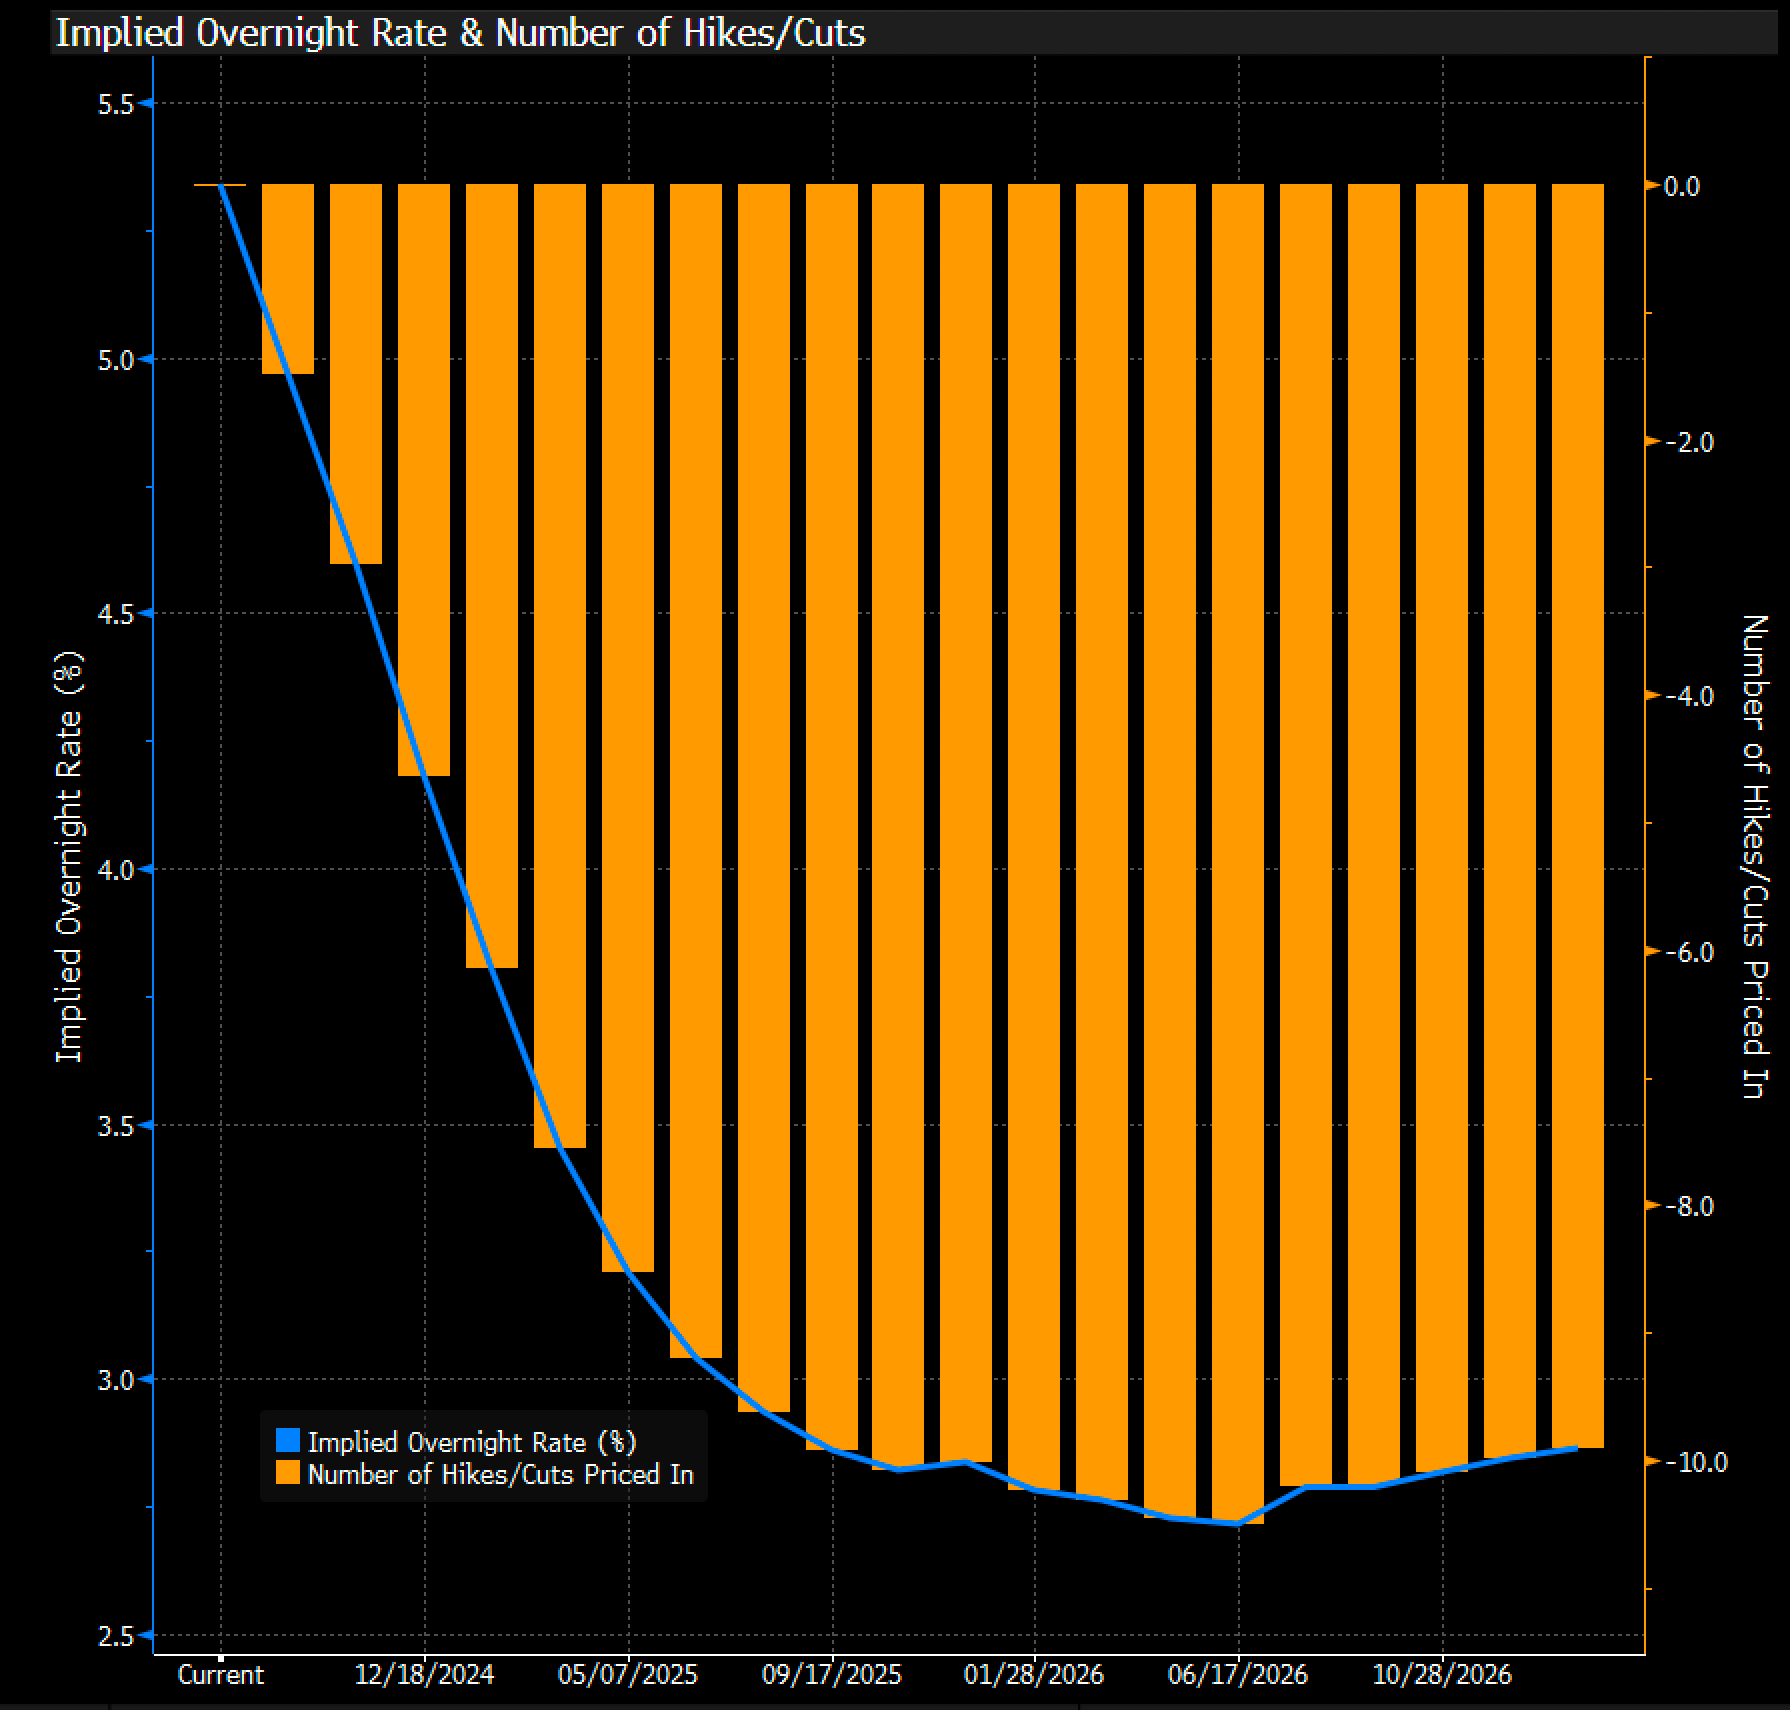
Put this in the “for what it’s worth” bucket, but the Fed Funds futures curve is currently “pricing in” 10 cuts over the next two years. I can promise you with 99% certainty this will be wrong. And the reason I say this is because if you were to look back at the last 10 years of Fed Funds implied futures rates curves, they would’ve been wrong 120 out of 120 months. They are quite literally always wrong.
The world is a complex adaptive system (read as Butterfly Effect or Dr. Ian Malcolm’s “Chaos Theory”) and small changes in initial conditions can lead to massive changes in the end result. And with interest rates, who knows what 50 basis points of cuts do to setting the world on a new trajectory.
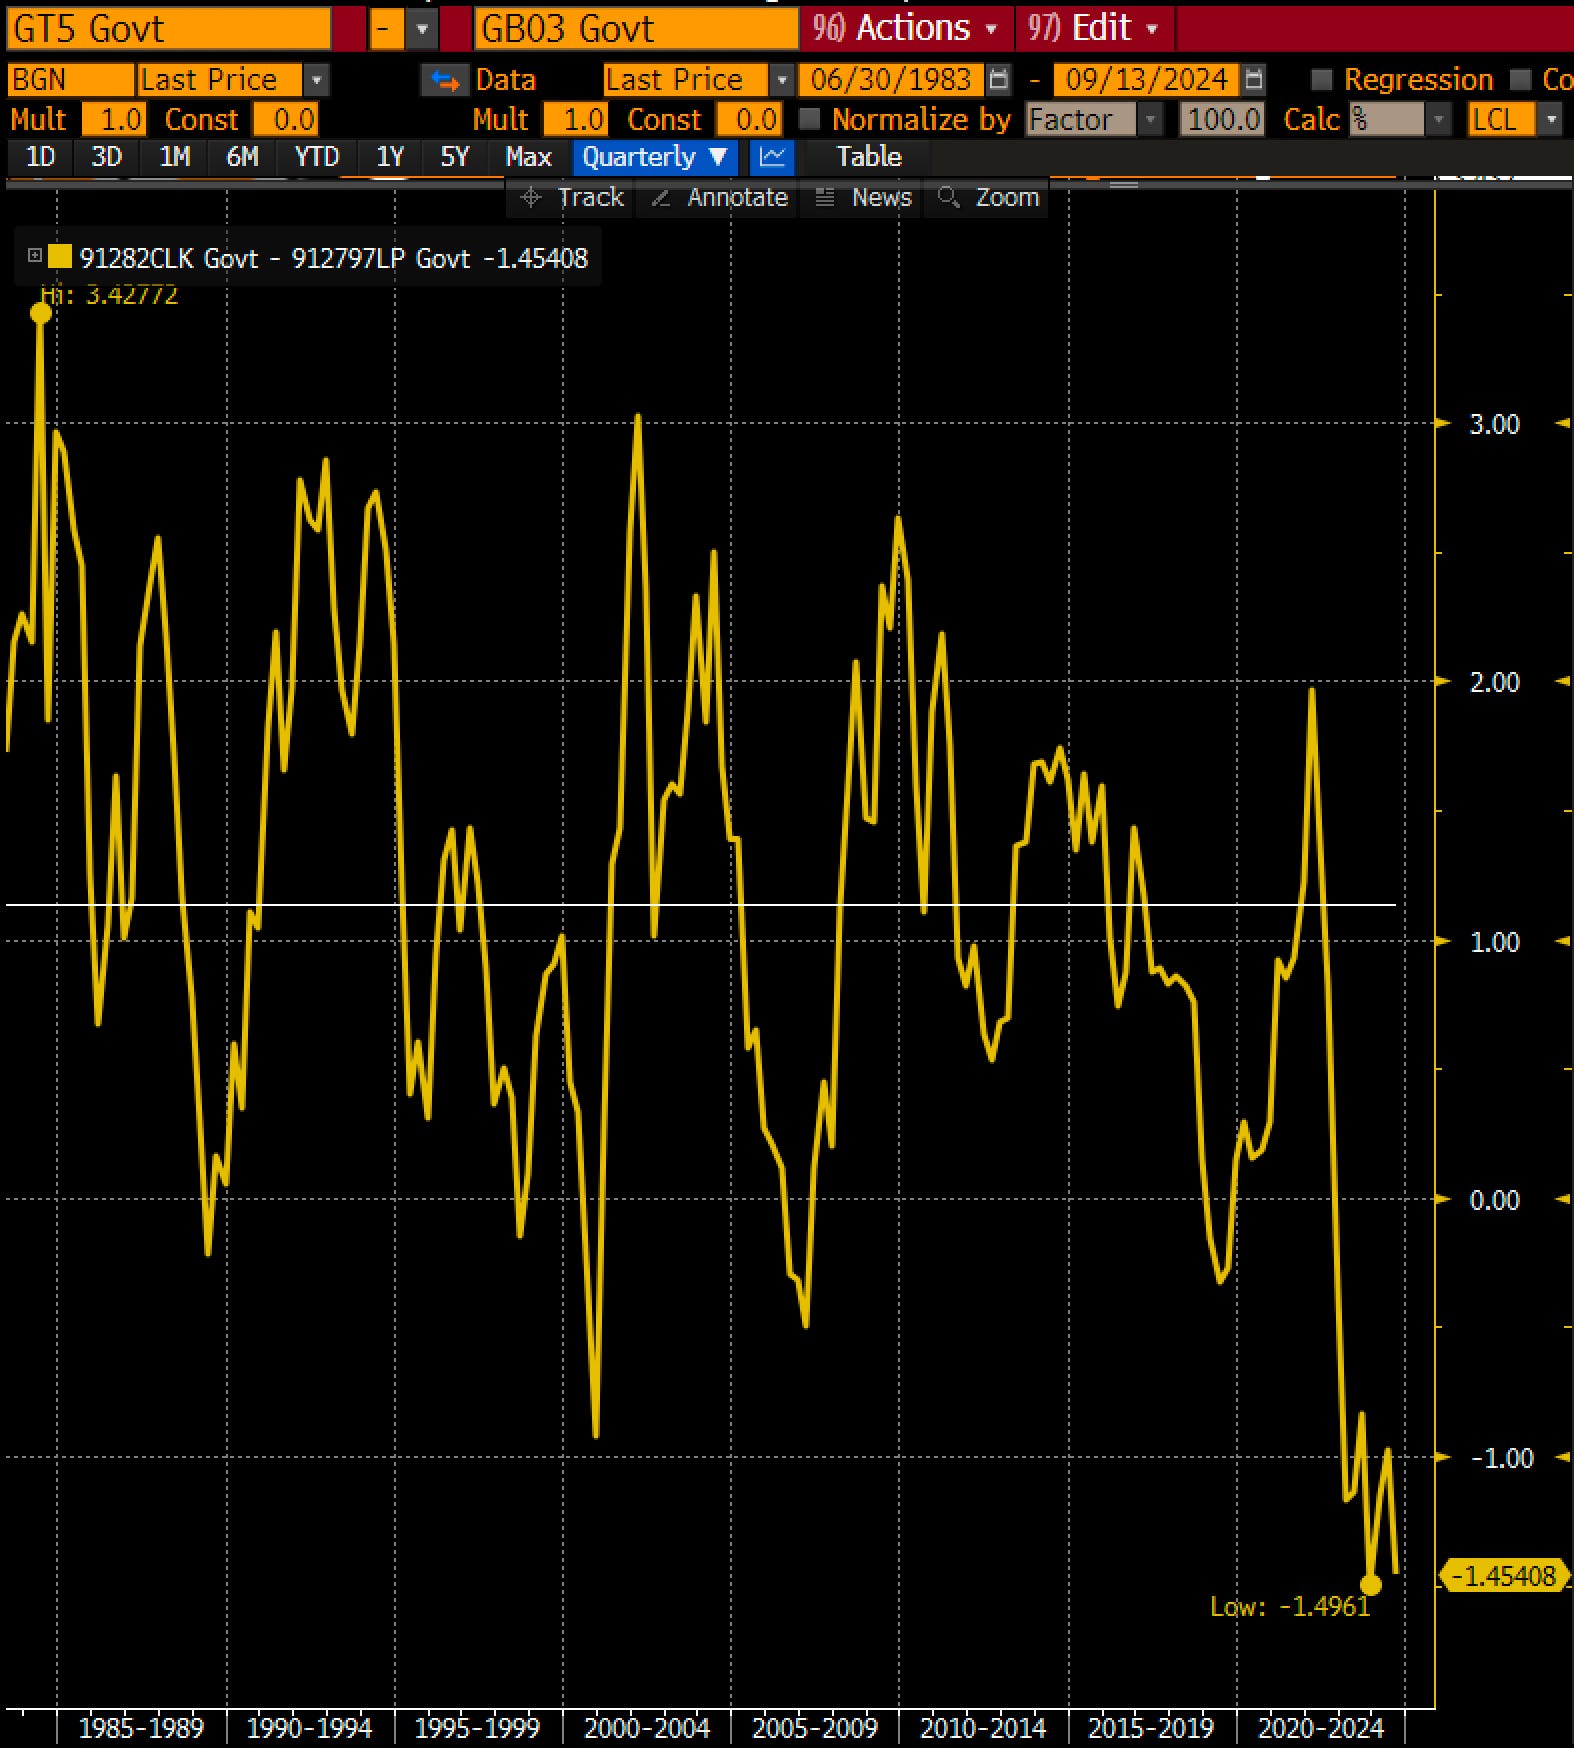
The more important thing for banks going forward, the spread between short rates and 5 year-treasuries should finally un-invert at some point unless we get some kind of boomerang inflation scenario 18-24 months down the road. This is going to be supportive of bank margins overall since (in general) banks fund short and lend long. In fact, looking back to the early 80s, the spread between the 3-month T-bill and the 5-year treasury has “averaged” around 115 basis points. Now average, is a dangerous thing because it rarely spends much time at the “average” spread, instead cyclically moving from inverted to sloped as environments change. This inversion has been historically terrible for banks NIM, and so any easing of this is a big tail wind to the banking sector.
Banks That Have Loved the Rate Hike Cycle
While more regional or liability sensitive banks have not enjoyed this rate hike cycle, there are banks that have enjoyed this rate hike cycle more than most. Those of you familiar with Victaurs posts know that I track backwards looking growth in Revenue/Share, Earnings/Share, and Tangible Book Value/Share. The reason why is that the people with track records of growing those above and beyond their peers tend to outperform in Total Shareholder Return. While it’s not perfect (i.e. the SIVB failure), in general you can use it as a screen to find banks that have strong management teams, that are allocating capital well, and that should perform well into the future. The most recent list I did was from the FY 2023 data going back about 7 years. That full list is available to paid members here and I have gotten great feedback from professional investors highlighting that some of these top names are their favorite picks as well. Read it here if you’d like.

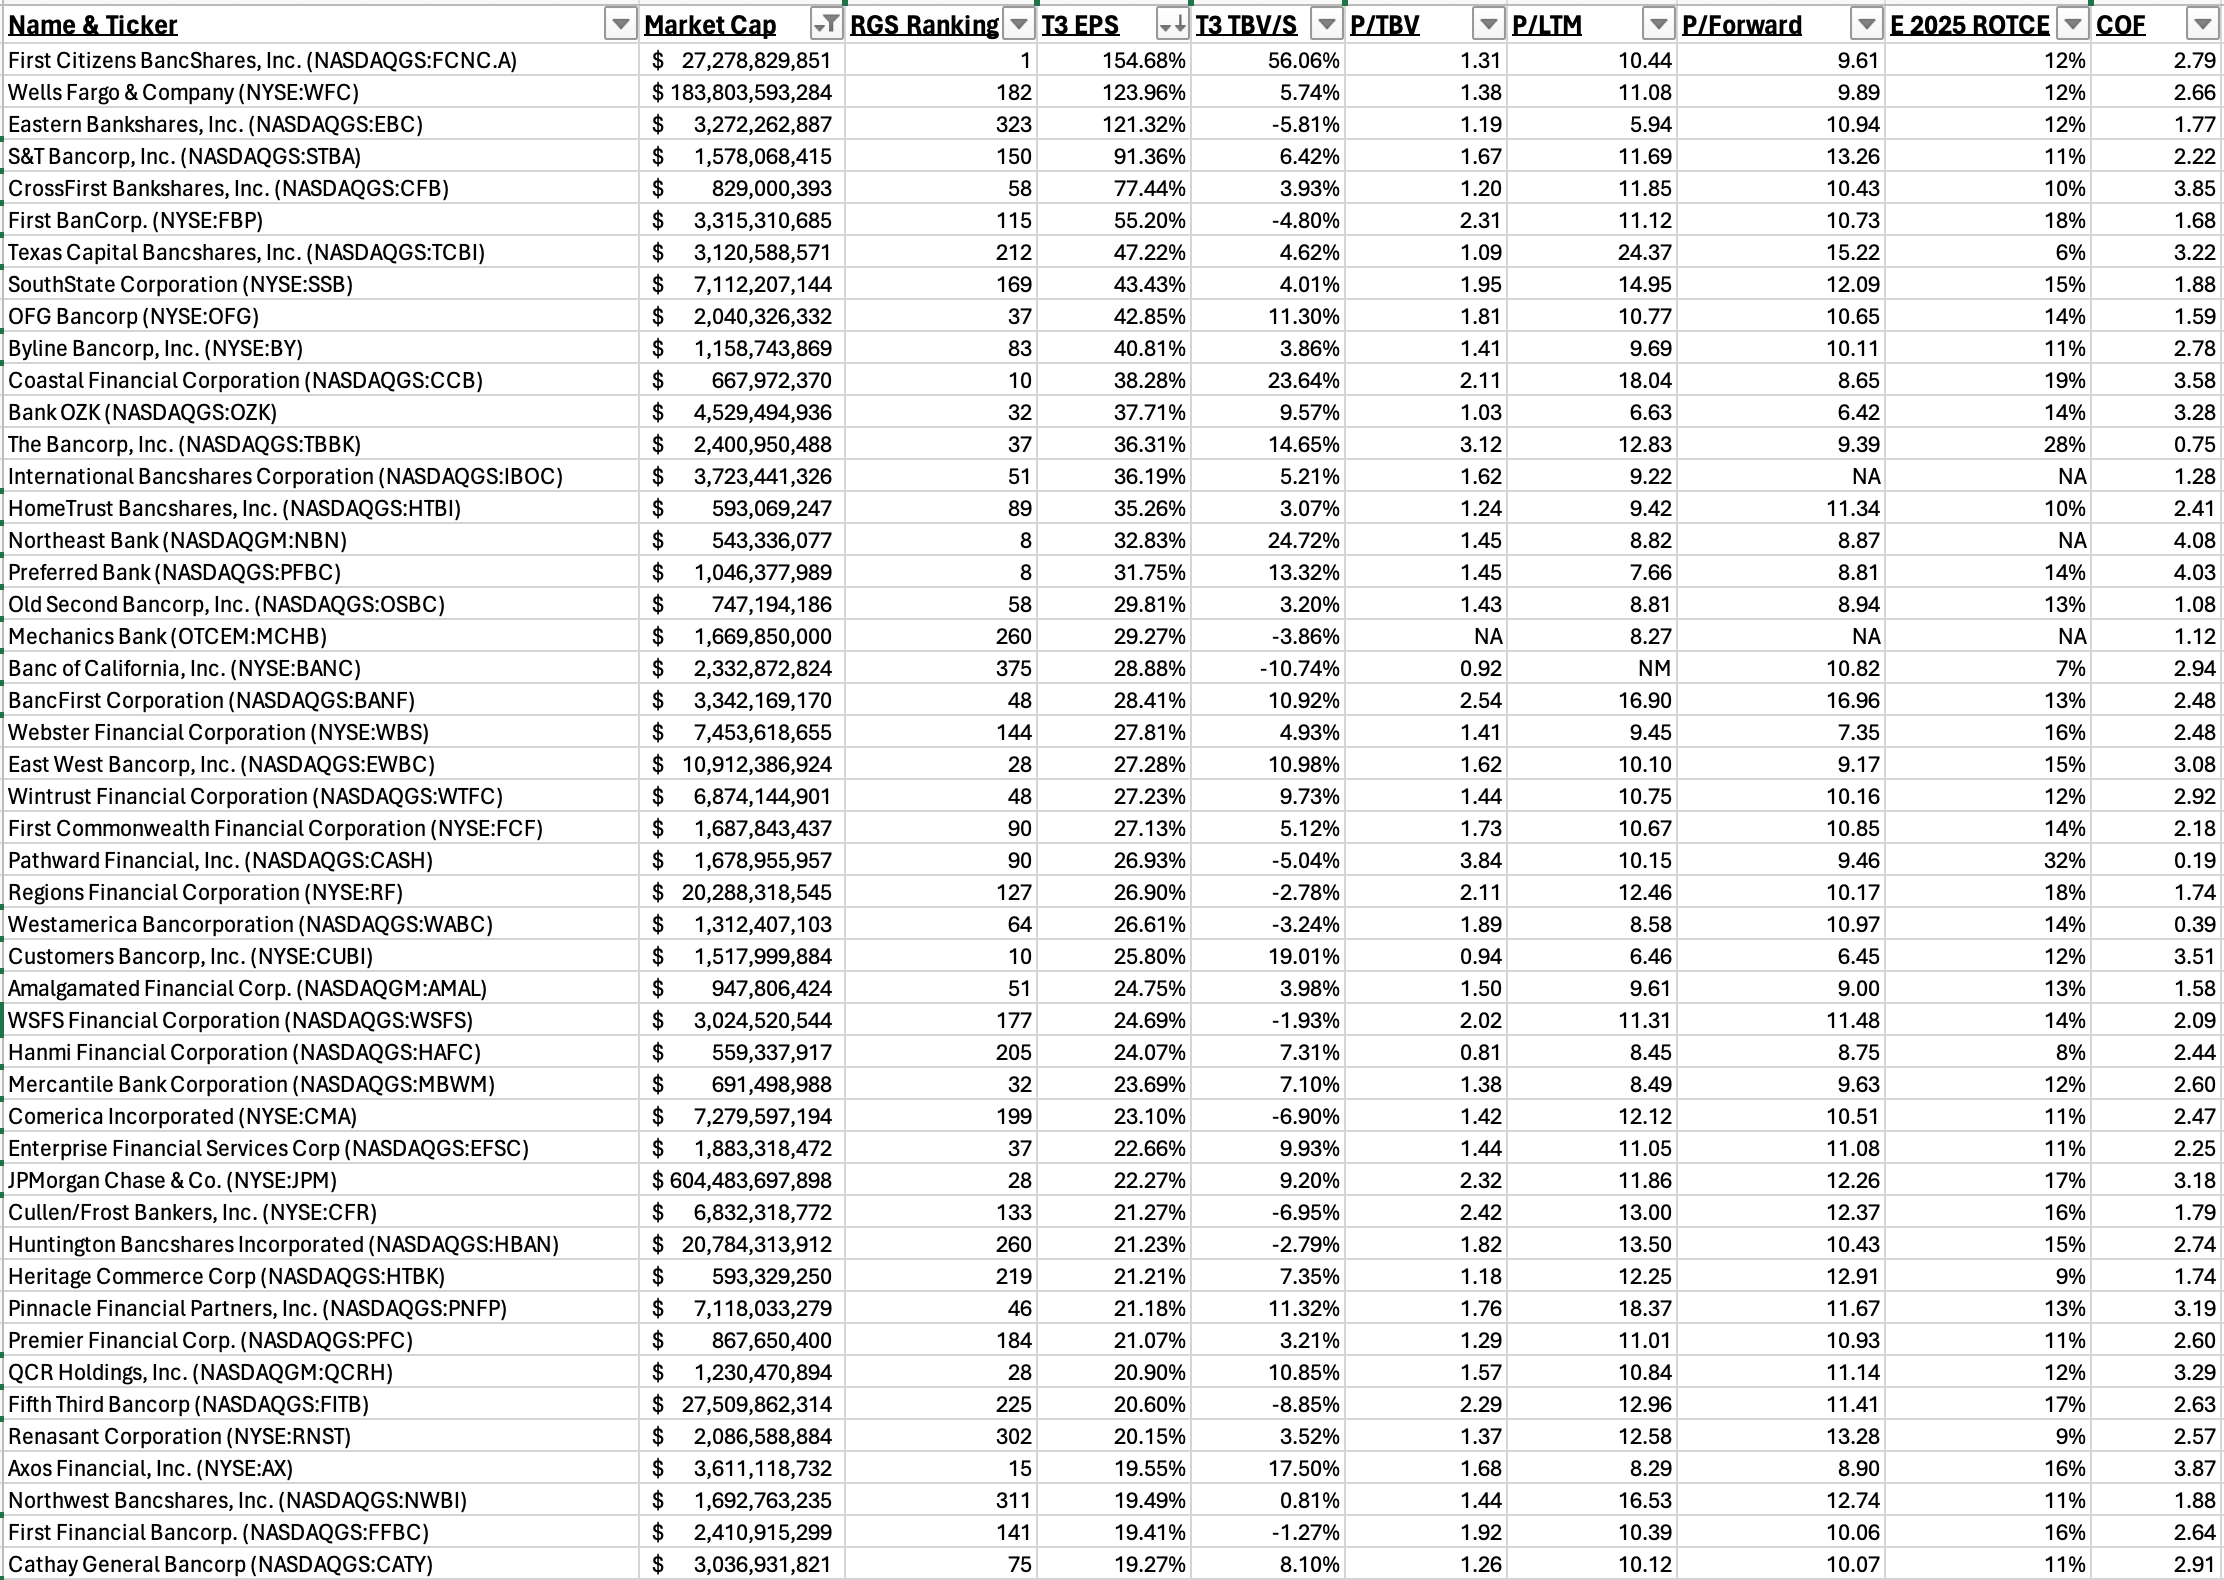
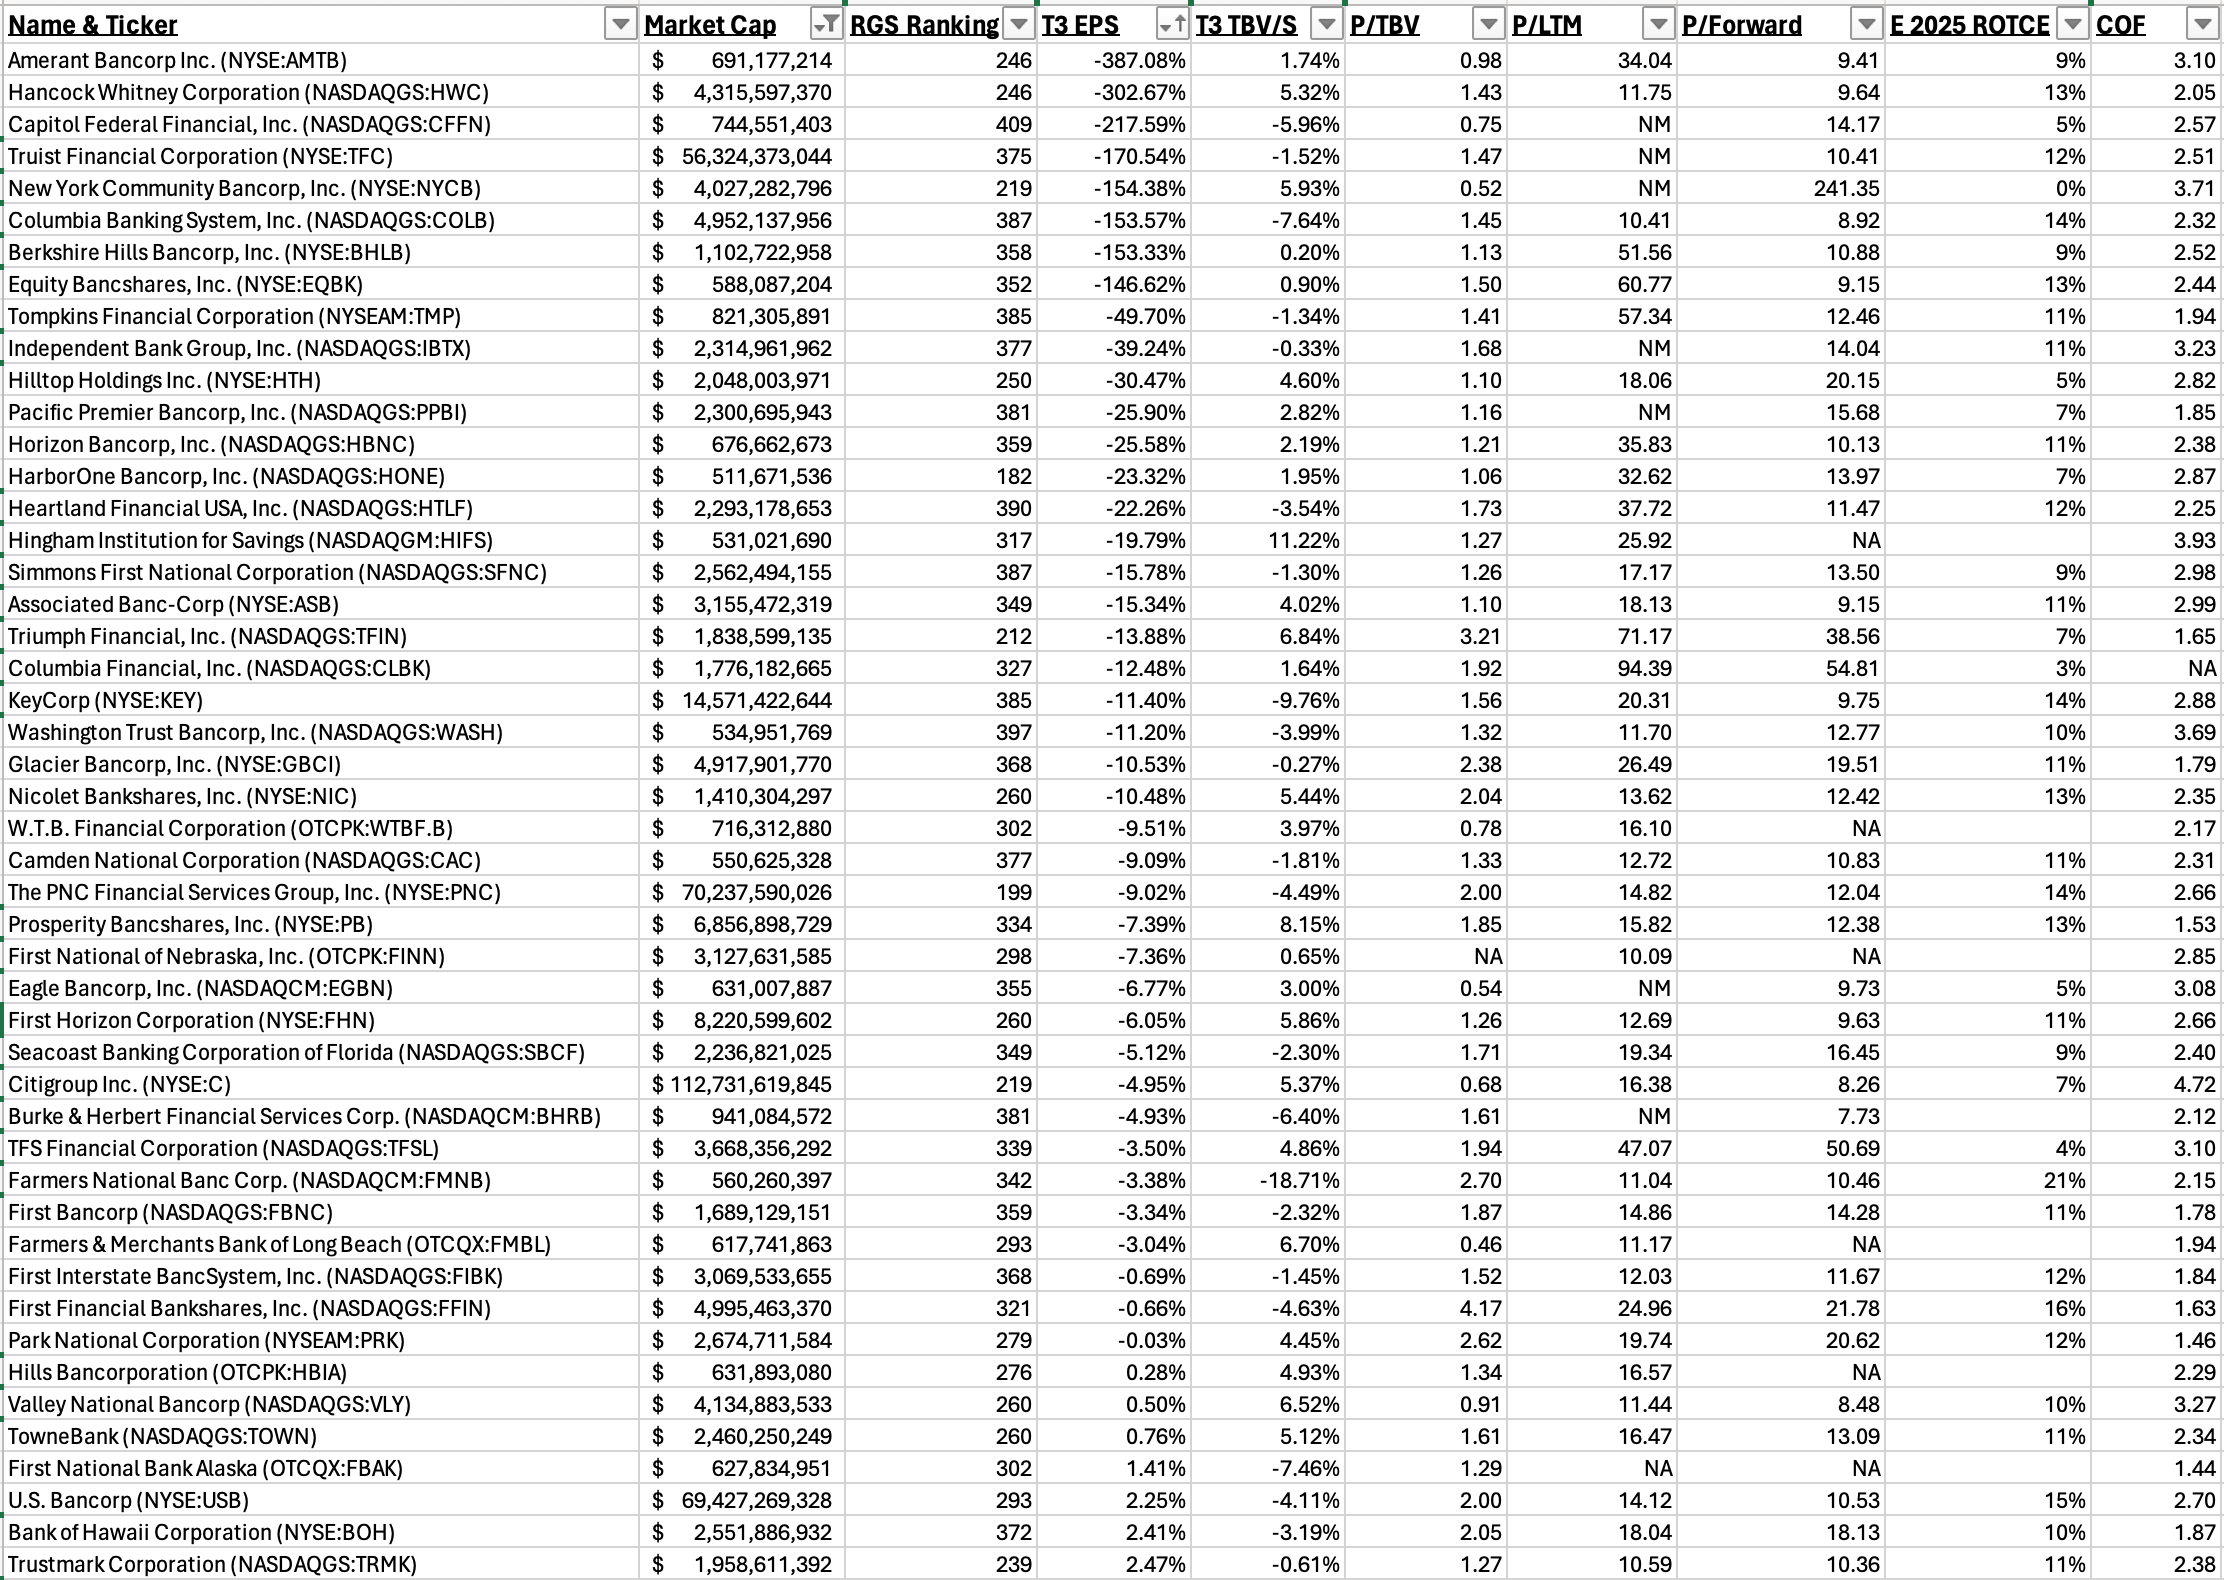
And this screen got me thinking about who has loved this rates up cycle the most. So, I recently went back in and tracked who has grown EPS the most over the past 3 years (from Q4 2020 to Q4 2023) because in theory those should be the most asset sensitive banks out there. Over that time period the 5-year Treasury went from 50 basis points or so up to almost 5% for a 450 basis point move. The point being these banks should be the ones with the most “potential” to lose in a falling rate environment.
I posted these down here as a screen, not an outright short list. Those of you that have followed me know I very much like FCNC.A right now and their outperformance over the past 3 years was from the FDIC assisted deal for SIVB. I added TBV/S over the same 3-year time period to help filter as well as COF.
FBP and JPM are two examples of tremendously high performing banks with high ROTCE’s that benefitted greatly from the rates up. And at JPM, Pinto’s recent comments that analysts were “being too optimistic” solidifies the point that rates down will not be great for everyone. OFG falls in this bucket as well for me.
STBA and FCF are two banks in Indiana, PA that had set up their balance sheets for rates up, and then saw it happen. Both now have to think about managing rates down.
And banks like CCB, CASH, and TBBK all operate in the Fintech/BaaS world with moat worthy non-interest income growth enabled by their superior ability to manage the regulatory scrutiny.
The inverse of this screen is below. Any of these names here are the ones that definitionally got caught “offsides” going into this rate hiking cycle above and beyond their peers. And they did that in spectacular fashion. Some of these names have already been taken out to the Woodshed (aka have been acquired).
As I sift through this list there are a few names that jump out to me, none are positions yet.
If they can pull off this merger, COLB looks cheap to its “full potential” 2025 & 2026 EPS stream.
ASB is another one that looks cheap to its “full potential” 2025 & 2026 EPS stream.
BHLB has been so bad for so long, but fundamentally they should benefit a lot from this environment we find ourselves in.
FFIN everyone’s favorite valuation “punching bag” because they sport such a world beating premium, should actually benefit a lot from this environment as well.
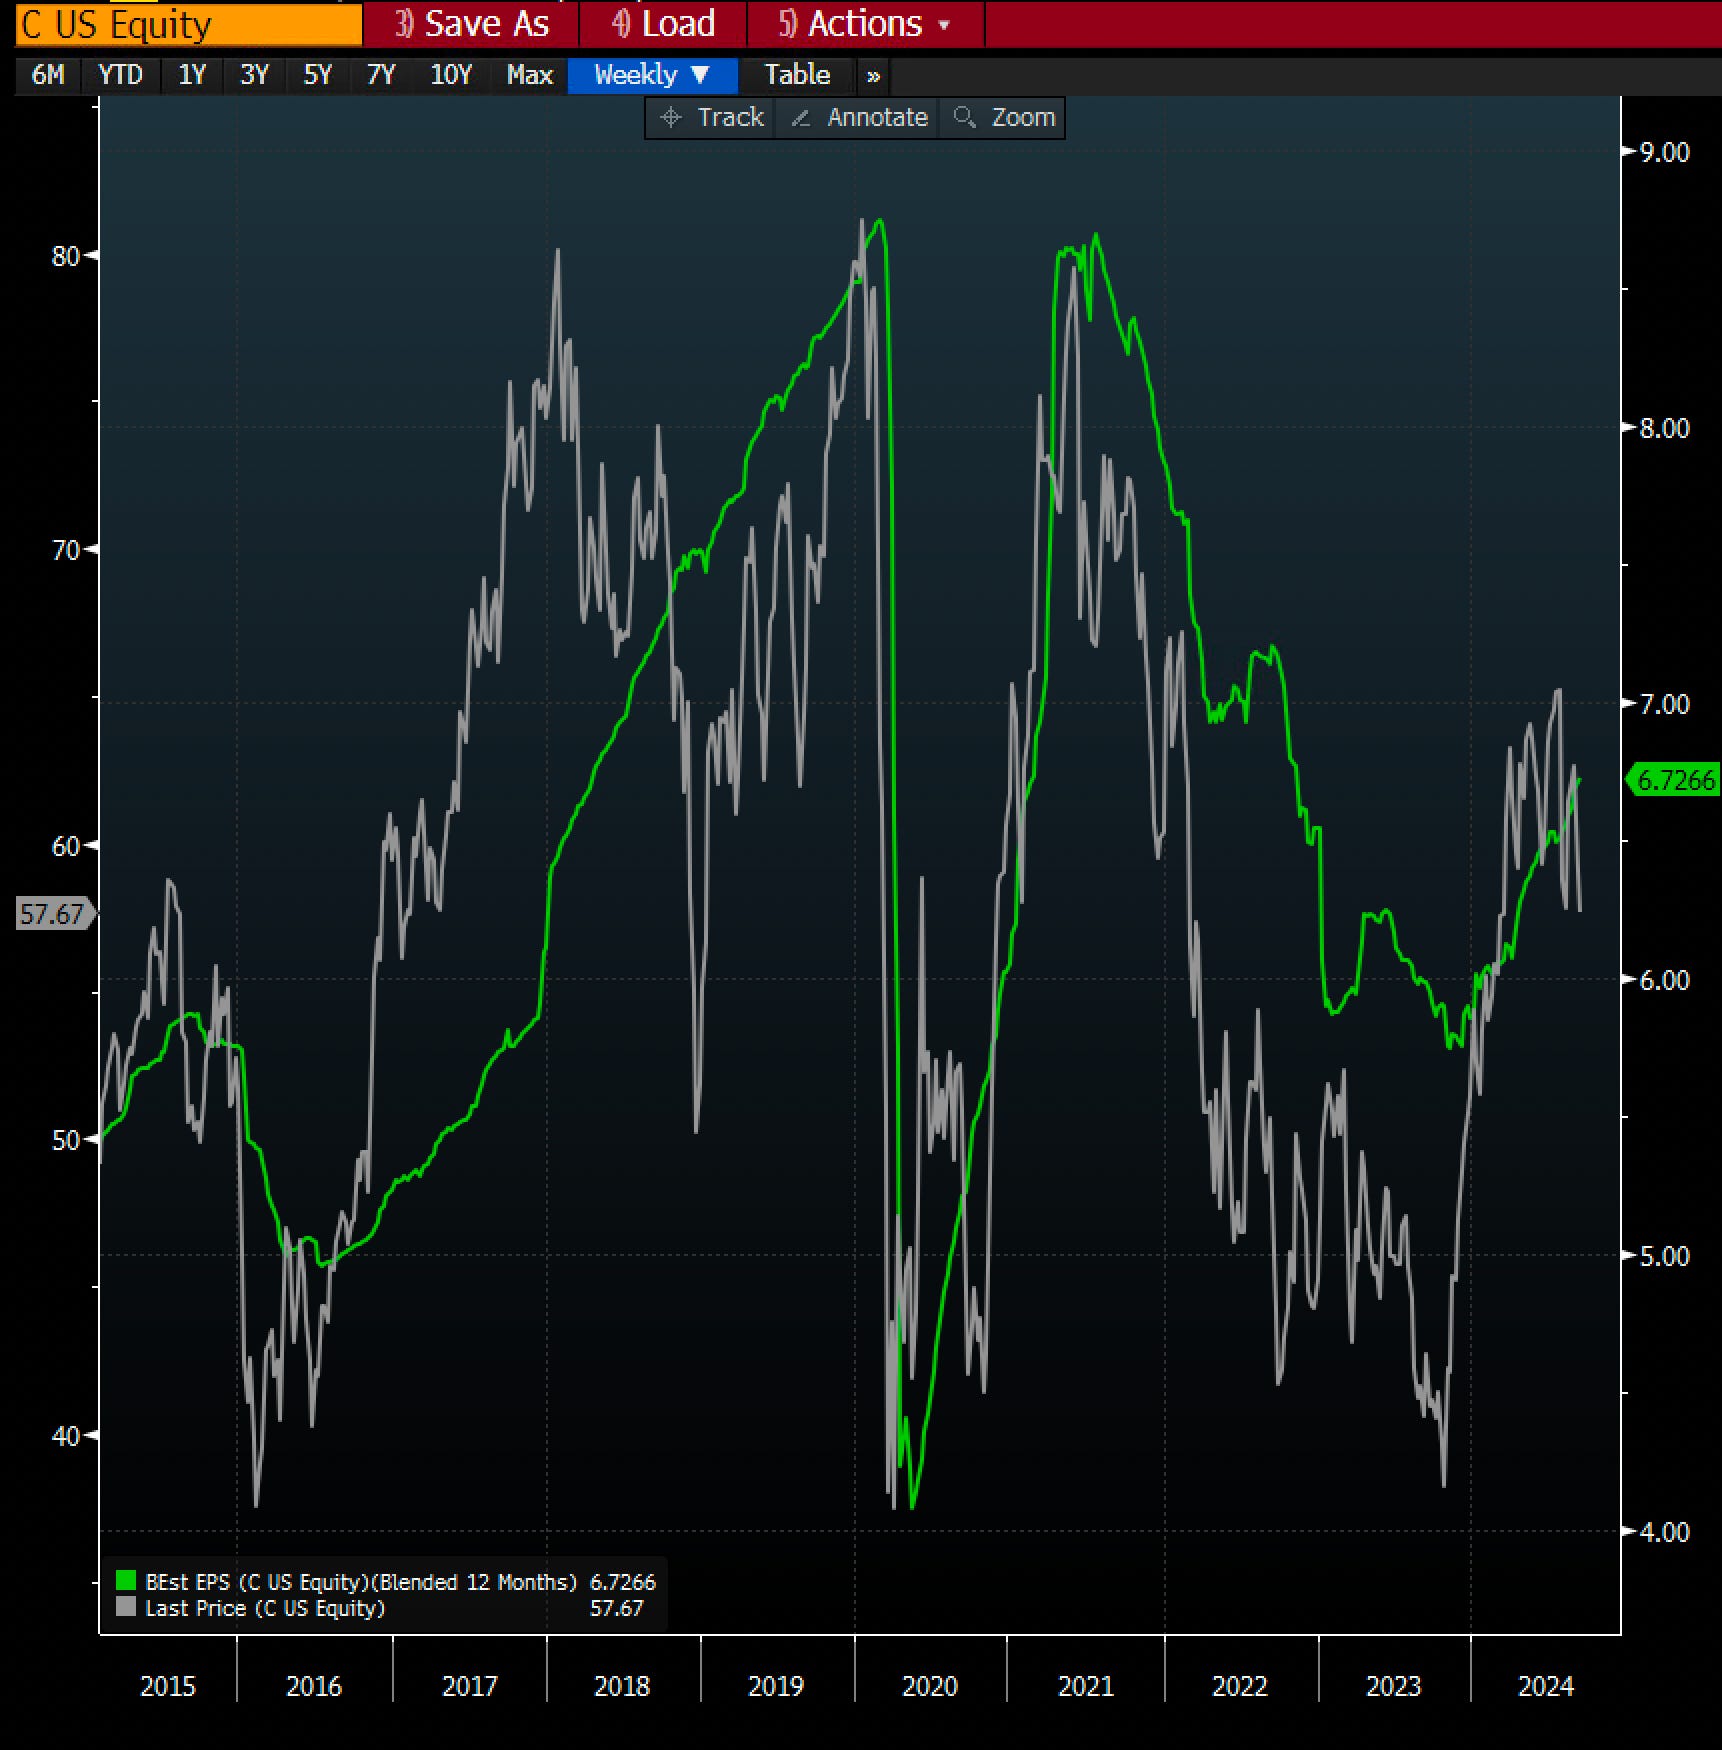
And one that I think is fairly cheap right now that is a position is Citibank. If they can continue to execute and pump out mid to high 7s next year then they should not be worth $60 bucks a share, it should be more. And BASEL III rolling back (if and when made official) should also help quite a bit.

How To Win by Doing Close to Nothing
One big thing that I’m certain the generalist investors are blissfully unaware of in bank land and that most investment bankers or casual investors are also unaware of is the set up in a certain population of banks right now.
Those banks are the ones with what I’ll call “hidden” tangible book value accretion coming down the pike. And tangible book value accretion that is achievable literally just by time passing.
As smart bank investors know, bank balance sheets are weird. And bank accounting on balance sheets is also weird.
What non-insider bank investors don’t know is that banks have to mark exactly one out of three pieces of their balance sheets to market quarterly, with its impacts flowing through to tangible common equity and tangible book value per share for everyone to see. This is the phenomenon of marking the bond book to market creating “AOCI” or Accumulated Other Comprehensive Income. It is (I believe) an archaic accounting principle brought on by the failure of a bunch of banks in the late 1980’s and still exists today. And it’s not going anywhere. It also served as the means for the host of Bank Doomers calling for BAC and SCHW to fail, don’t worry I know who you are.
But here are the two things about AOCI.
The market-to-market gains or losses on bonds flow through to TCE/TBV in time, however in the end these gains or losses all end up at zero as the bond pays down and/or matures. And with many of the “bad bonds” having been bought in 2020 and 2021, a handful of years ago the impacts of these bad decisions are melting away. So over time even big negative AOCI marks (meaning lower TBV) come back to zero creating higher TBV. With no credit risk to speak of, just time passing (and rates not going back up).
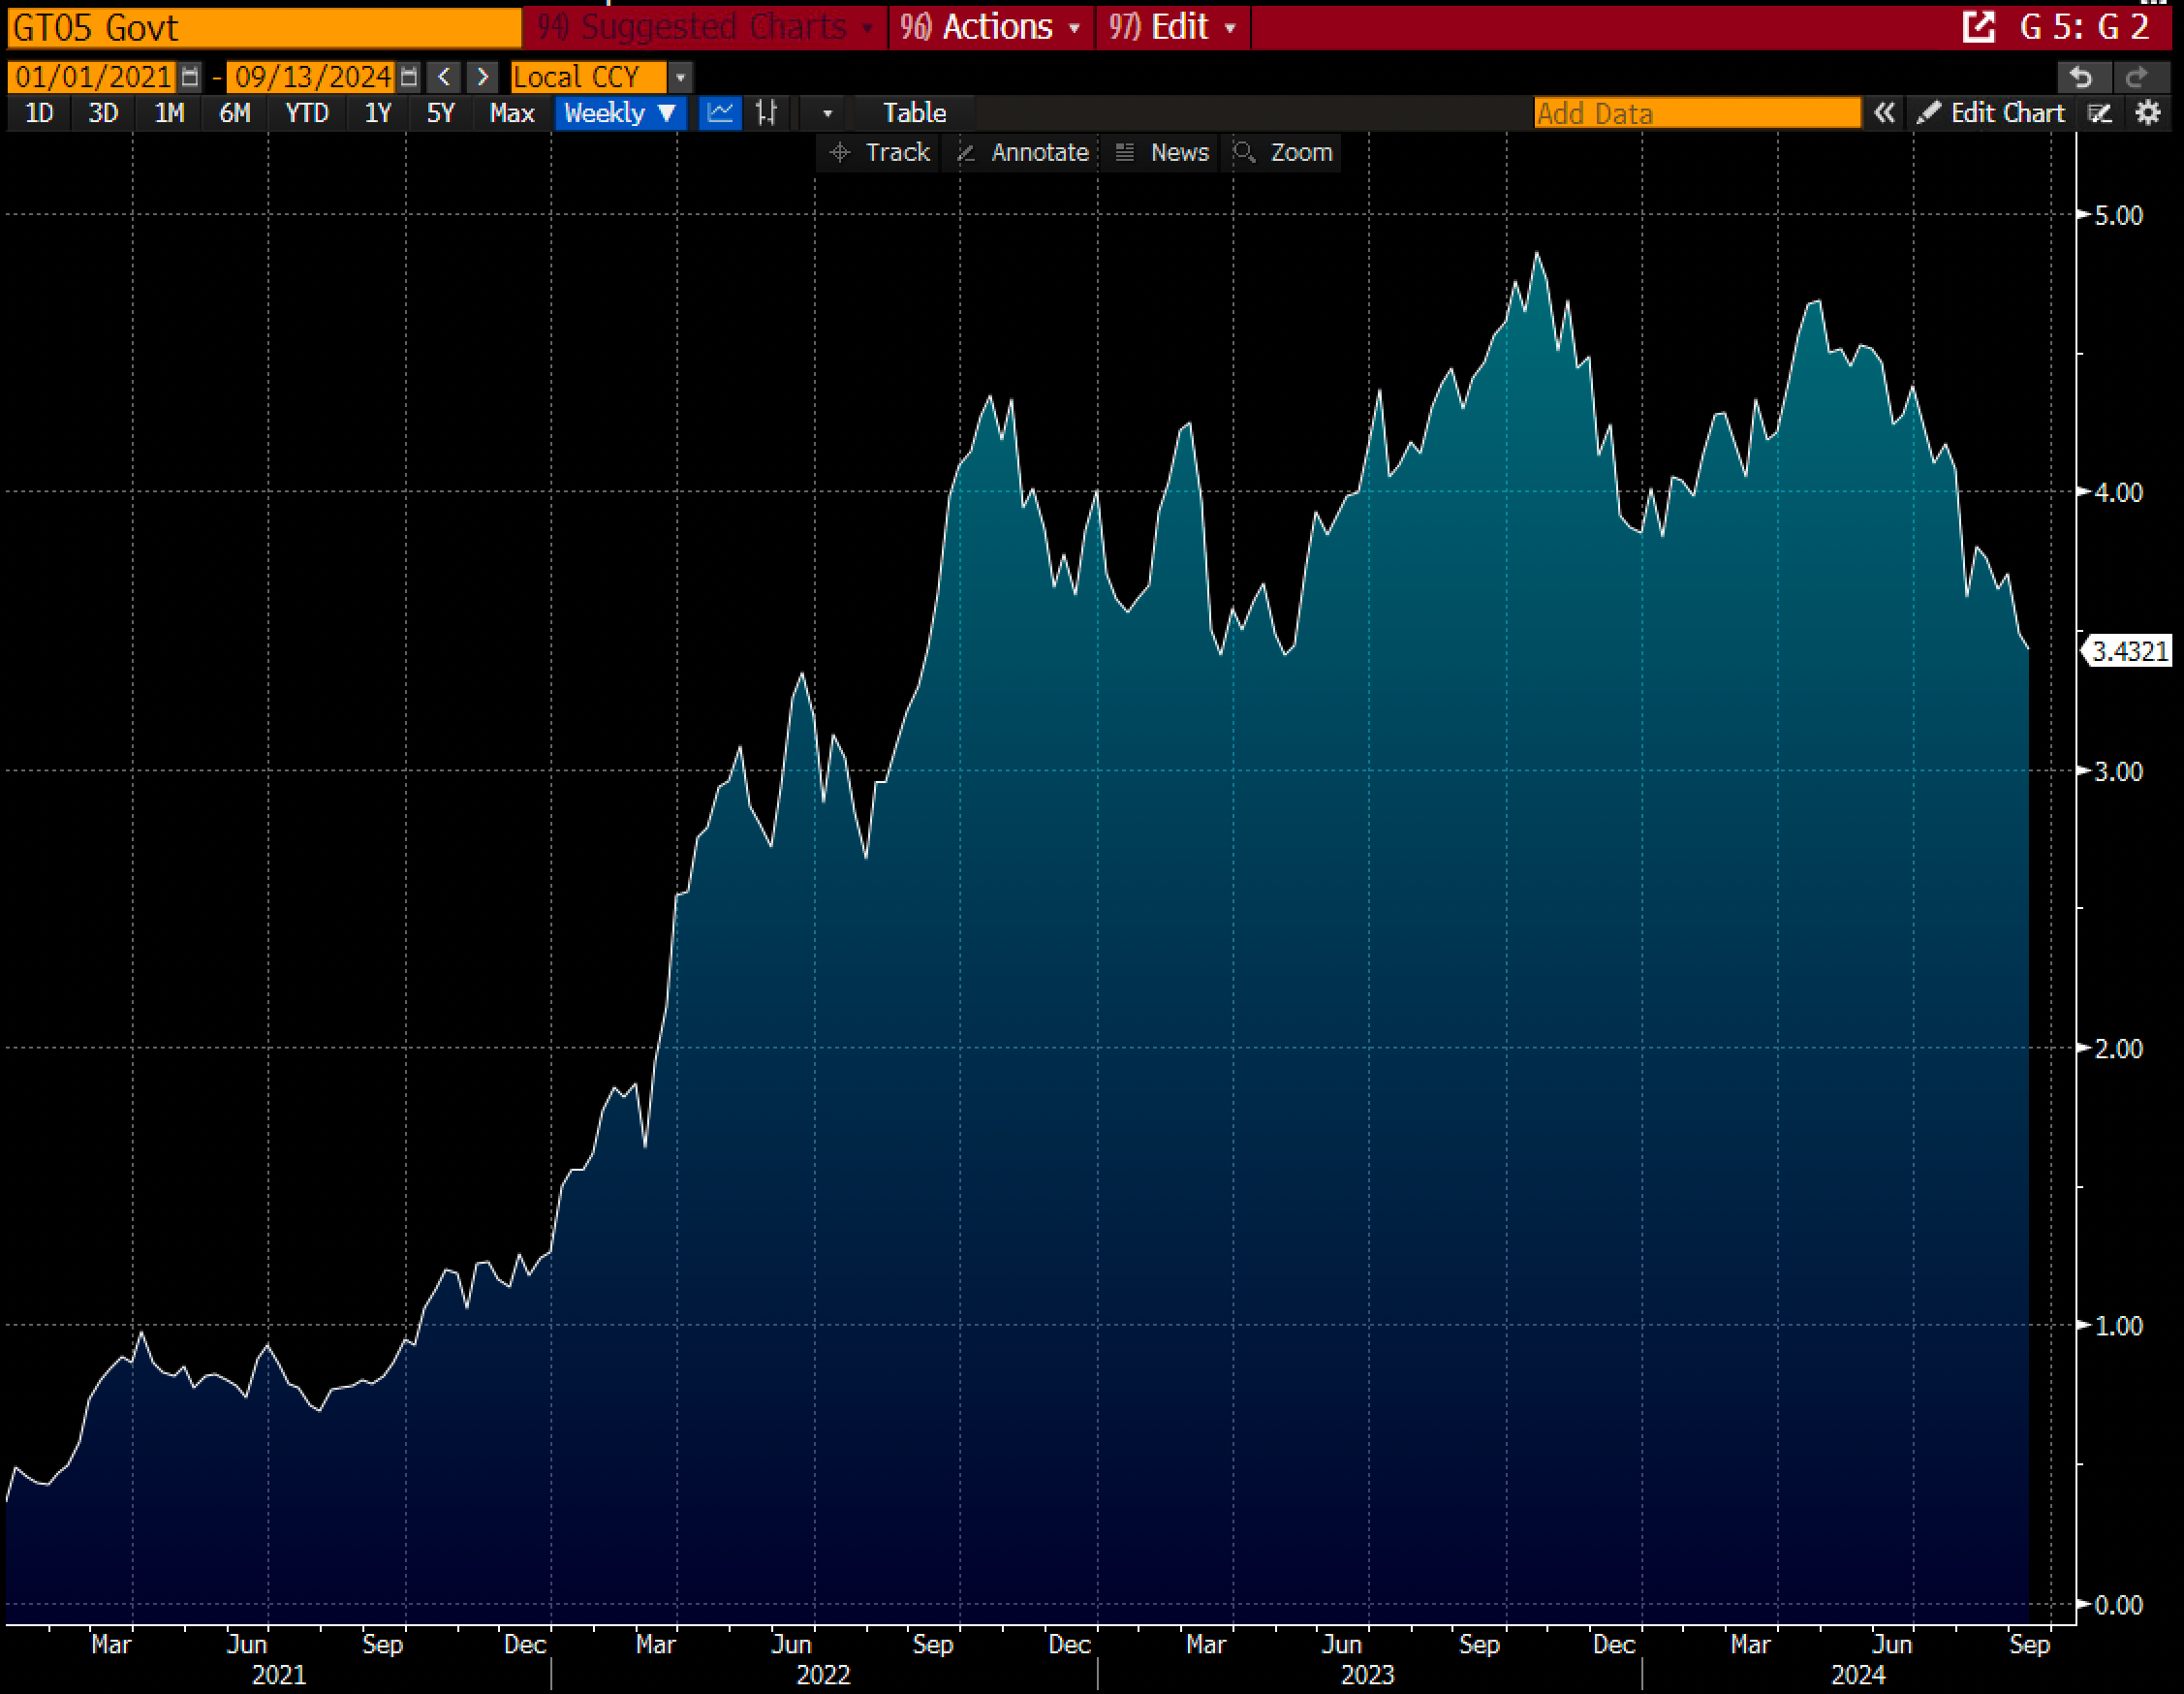
The market rates on bonds swings about wildly at times. At the end of Q2 in June the 5-year treasury was at 4.37% and today as I write this it is at 3.43%. Which means that TBV for most banks QoQ will have gone up materially just with rates having come down.
Putting those two together, if rates on the long end stay here, banks will grow & accrete TBV just with time passing. And so, there are a bunch of banks that have a fair amount of AOCI baked into their numbers which may appear expensive but are actually pretty cheap if you consider that they are getting back some of that TCE/TBV just with the passage of time. It’s as close to “risk less” value creation as it comes.
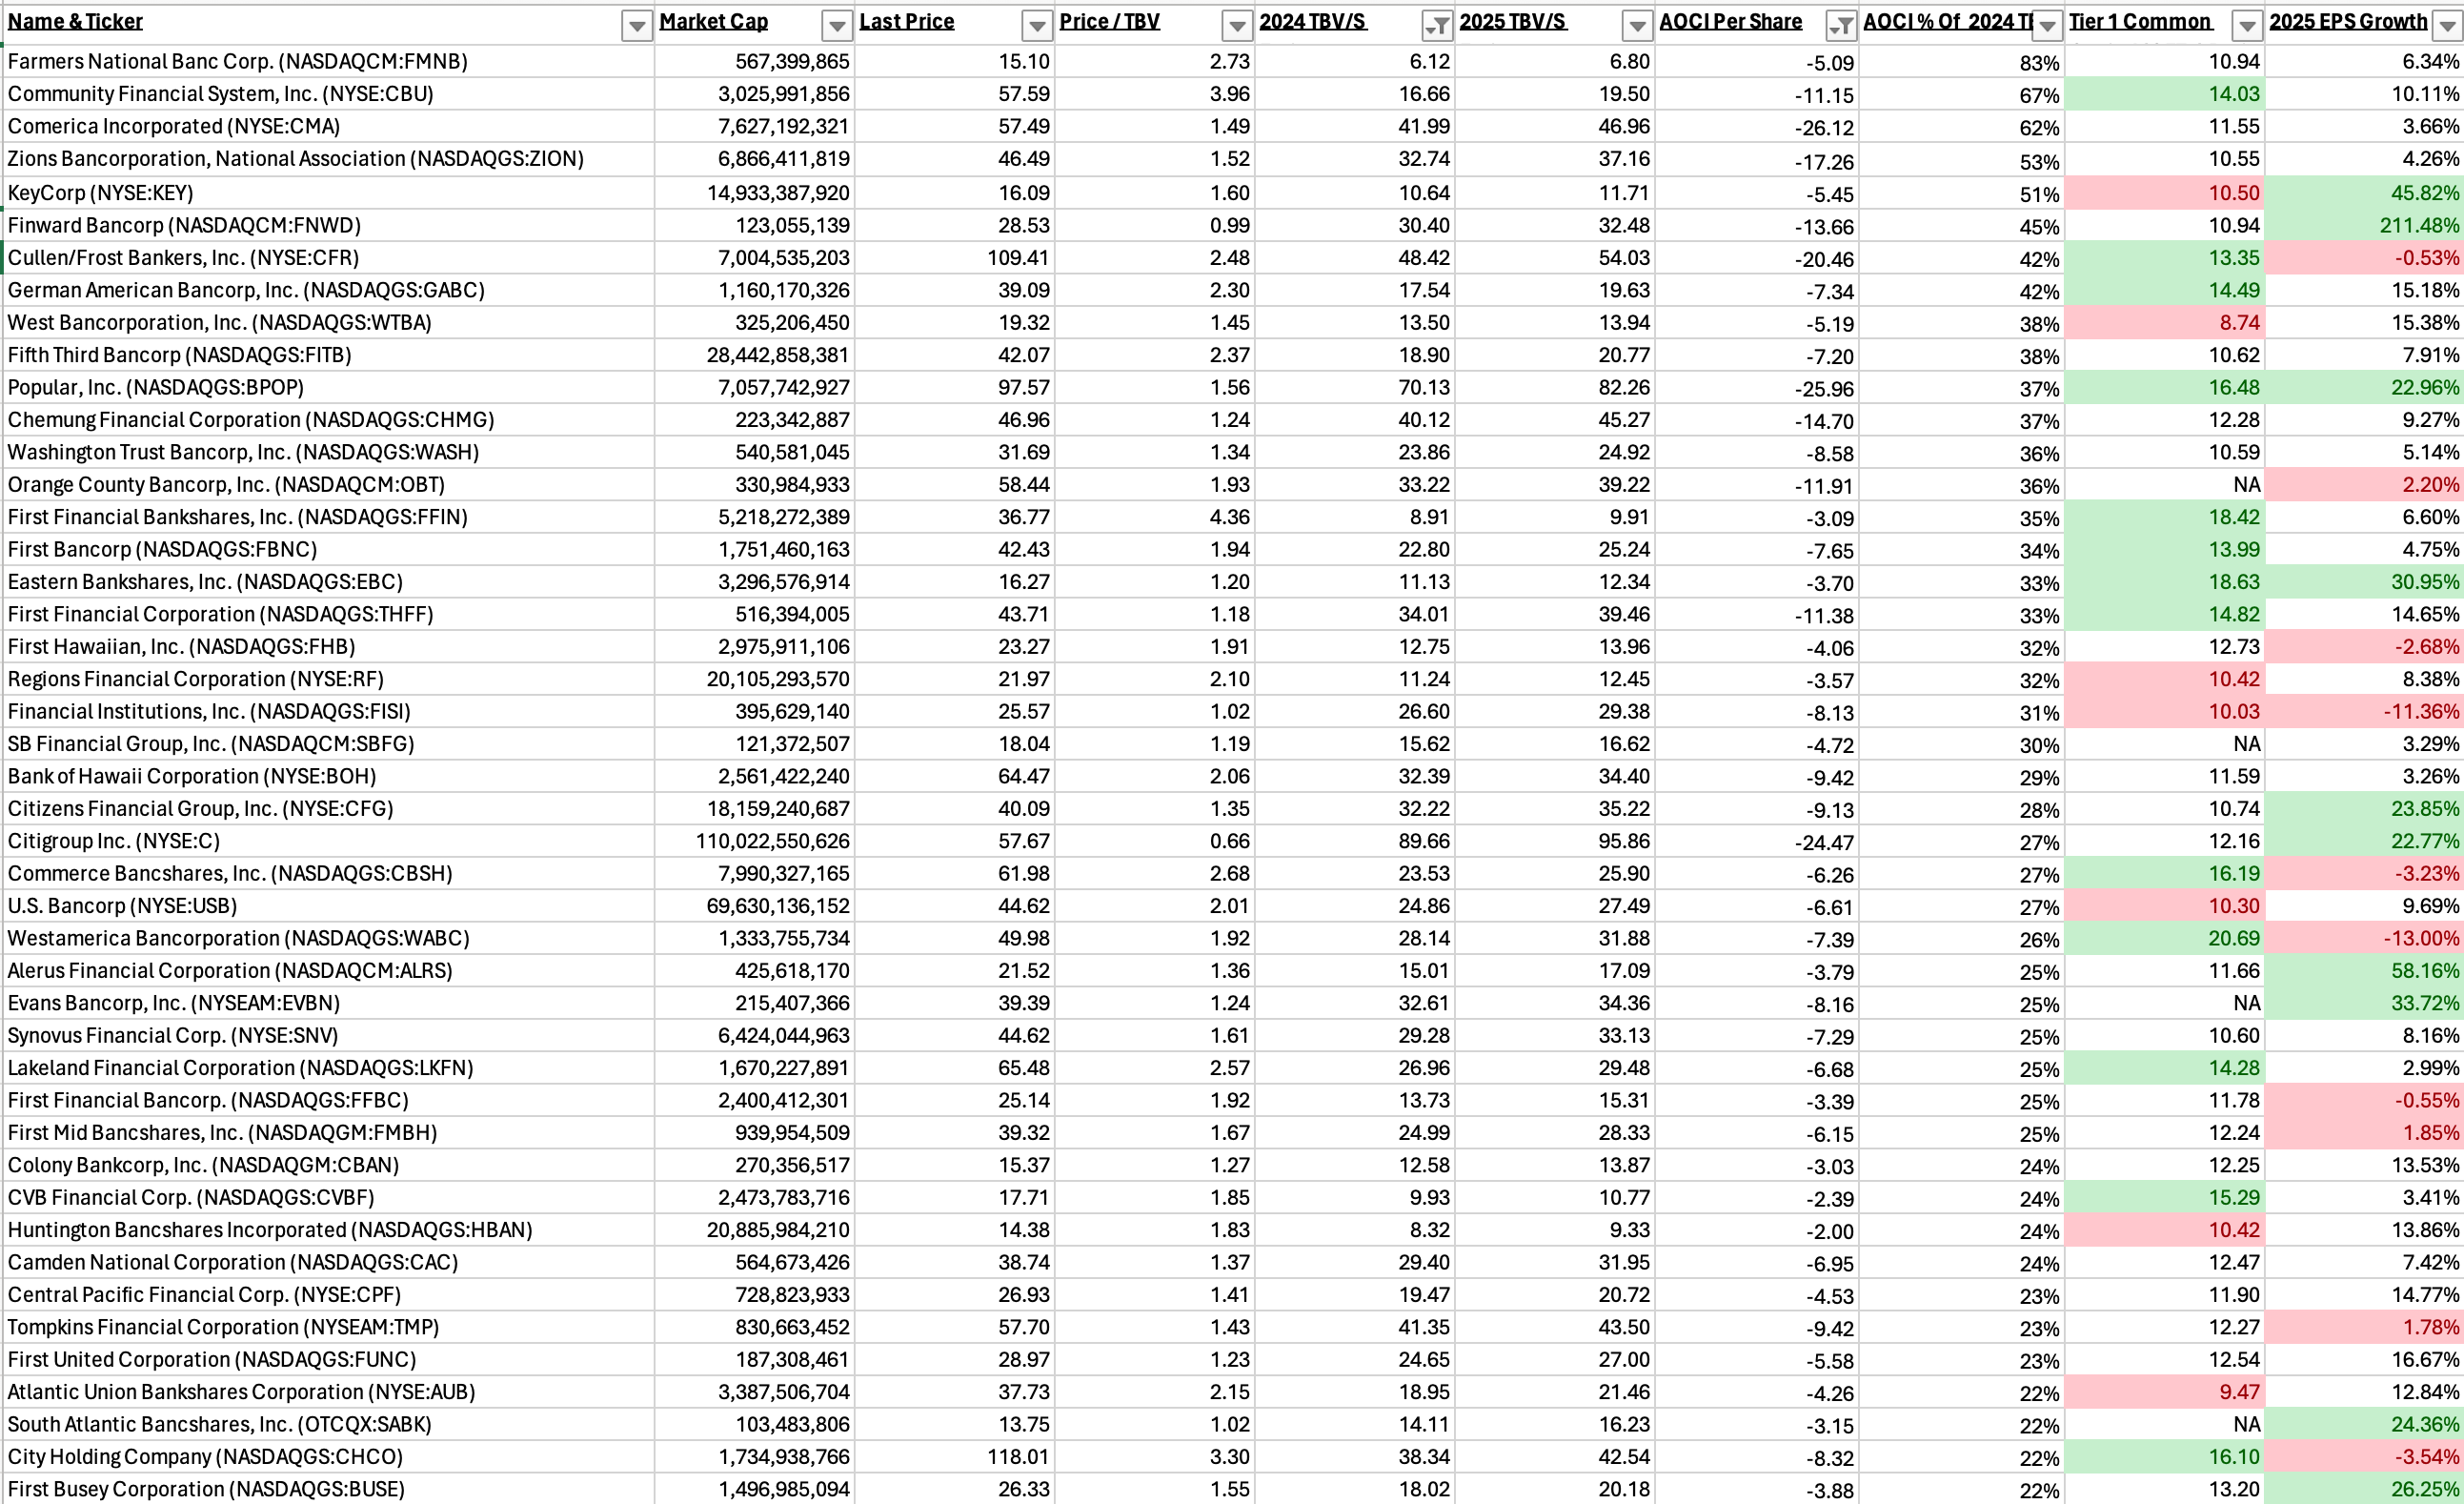
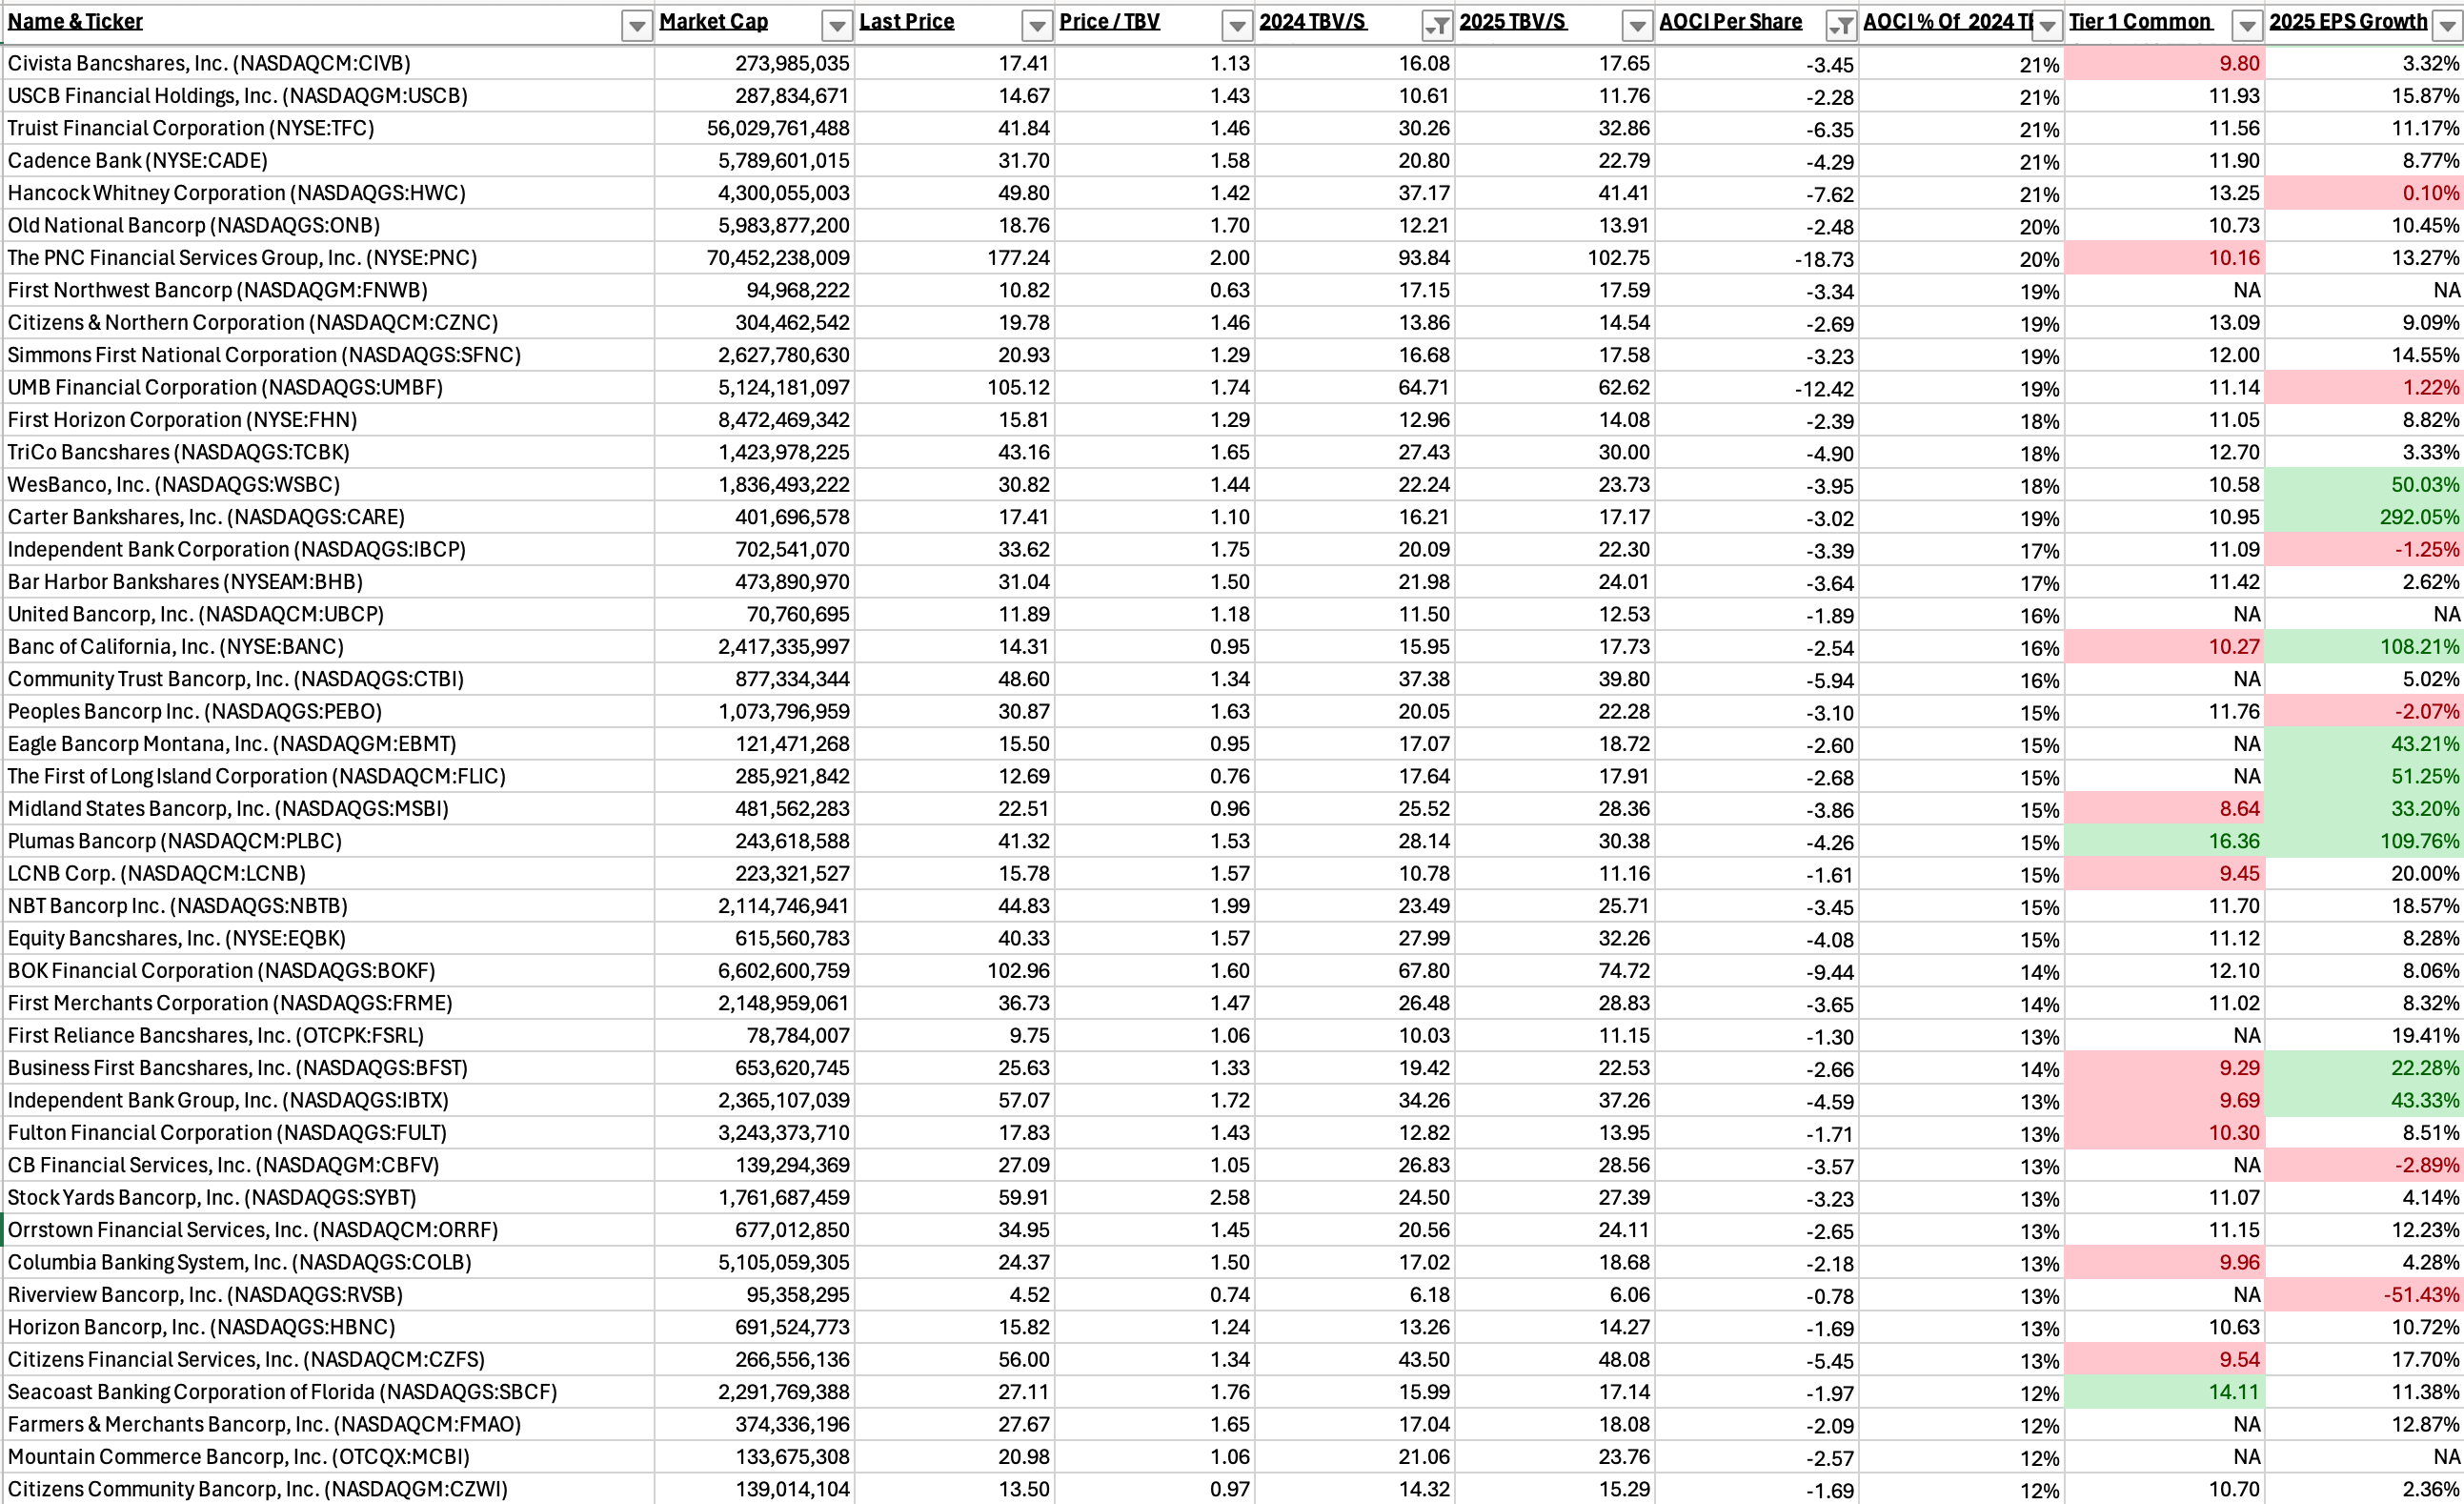
Here is a list of “winners by doing nothing” in banks. I sifted by AOCI as a percentage of 2024 TBV/S to highlight who had a lot of bond losses relative to capital. Note: some of these people may have (and did) do big bond restructures like KEY intra quarter. More banks are likely looking at doing these because the impact to TCE is much less today.
In this “win by doing nothing” screen I own & like BPOP and C. Which you all know.

I added in estimated 2025 EPS growth and CET1 Ratios too. In theory you would love to buy someone with a lot of TBV/S locked up in AOCI set to come back to them, with growing EPS in 2025, and with plenty of CET1 to potentially buy back more shares. Green means top 25th percentile in the category out of the 168 banks with reliable enough forward estimates. You’ll also notice I put in 2025 TBV/S to serve as a goal post for the amount of TBV coming back via AOCI over the next 15 months (plus retained earnings of course).
You’re not “allowed to do this”, but looking at a bank like BPOP who has $26 bucks a share locked up in AOCI, adding that back to 2024 TBV of $70 gives you an AOCI adjusted TBV of $96 and a Price to Fully Accreted AOCI of 101%. Hardly expensive and complete voodoo back of the napkin math, but the concept is the key. These banks have a lot of TBV accretion coming without a lot of risk which is a powerful tailwind. Maybe these “Island Banks” like BPOP, FHB, and BOH aren’t that expensive?
Gold, Oil, & Commodities
YTD Gold is actually outperforming all major indices and is losing only to BTC. Which is kind of odd to me. Gold’s price action has been a bit jarring since it’s just a yellow rock, but thinking about the global uncertainty in Emerging economies, the never-ending Ukraine/Russia situation, the constant threat of China/Taiwan, and oh yea, the historic fiscal deficit being run by Uncle Sam with no signs of slowing maybe the gold rally makes a lot of sense. And now we have an election season coming to close in the US to top it all off.
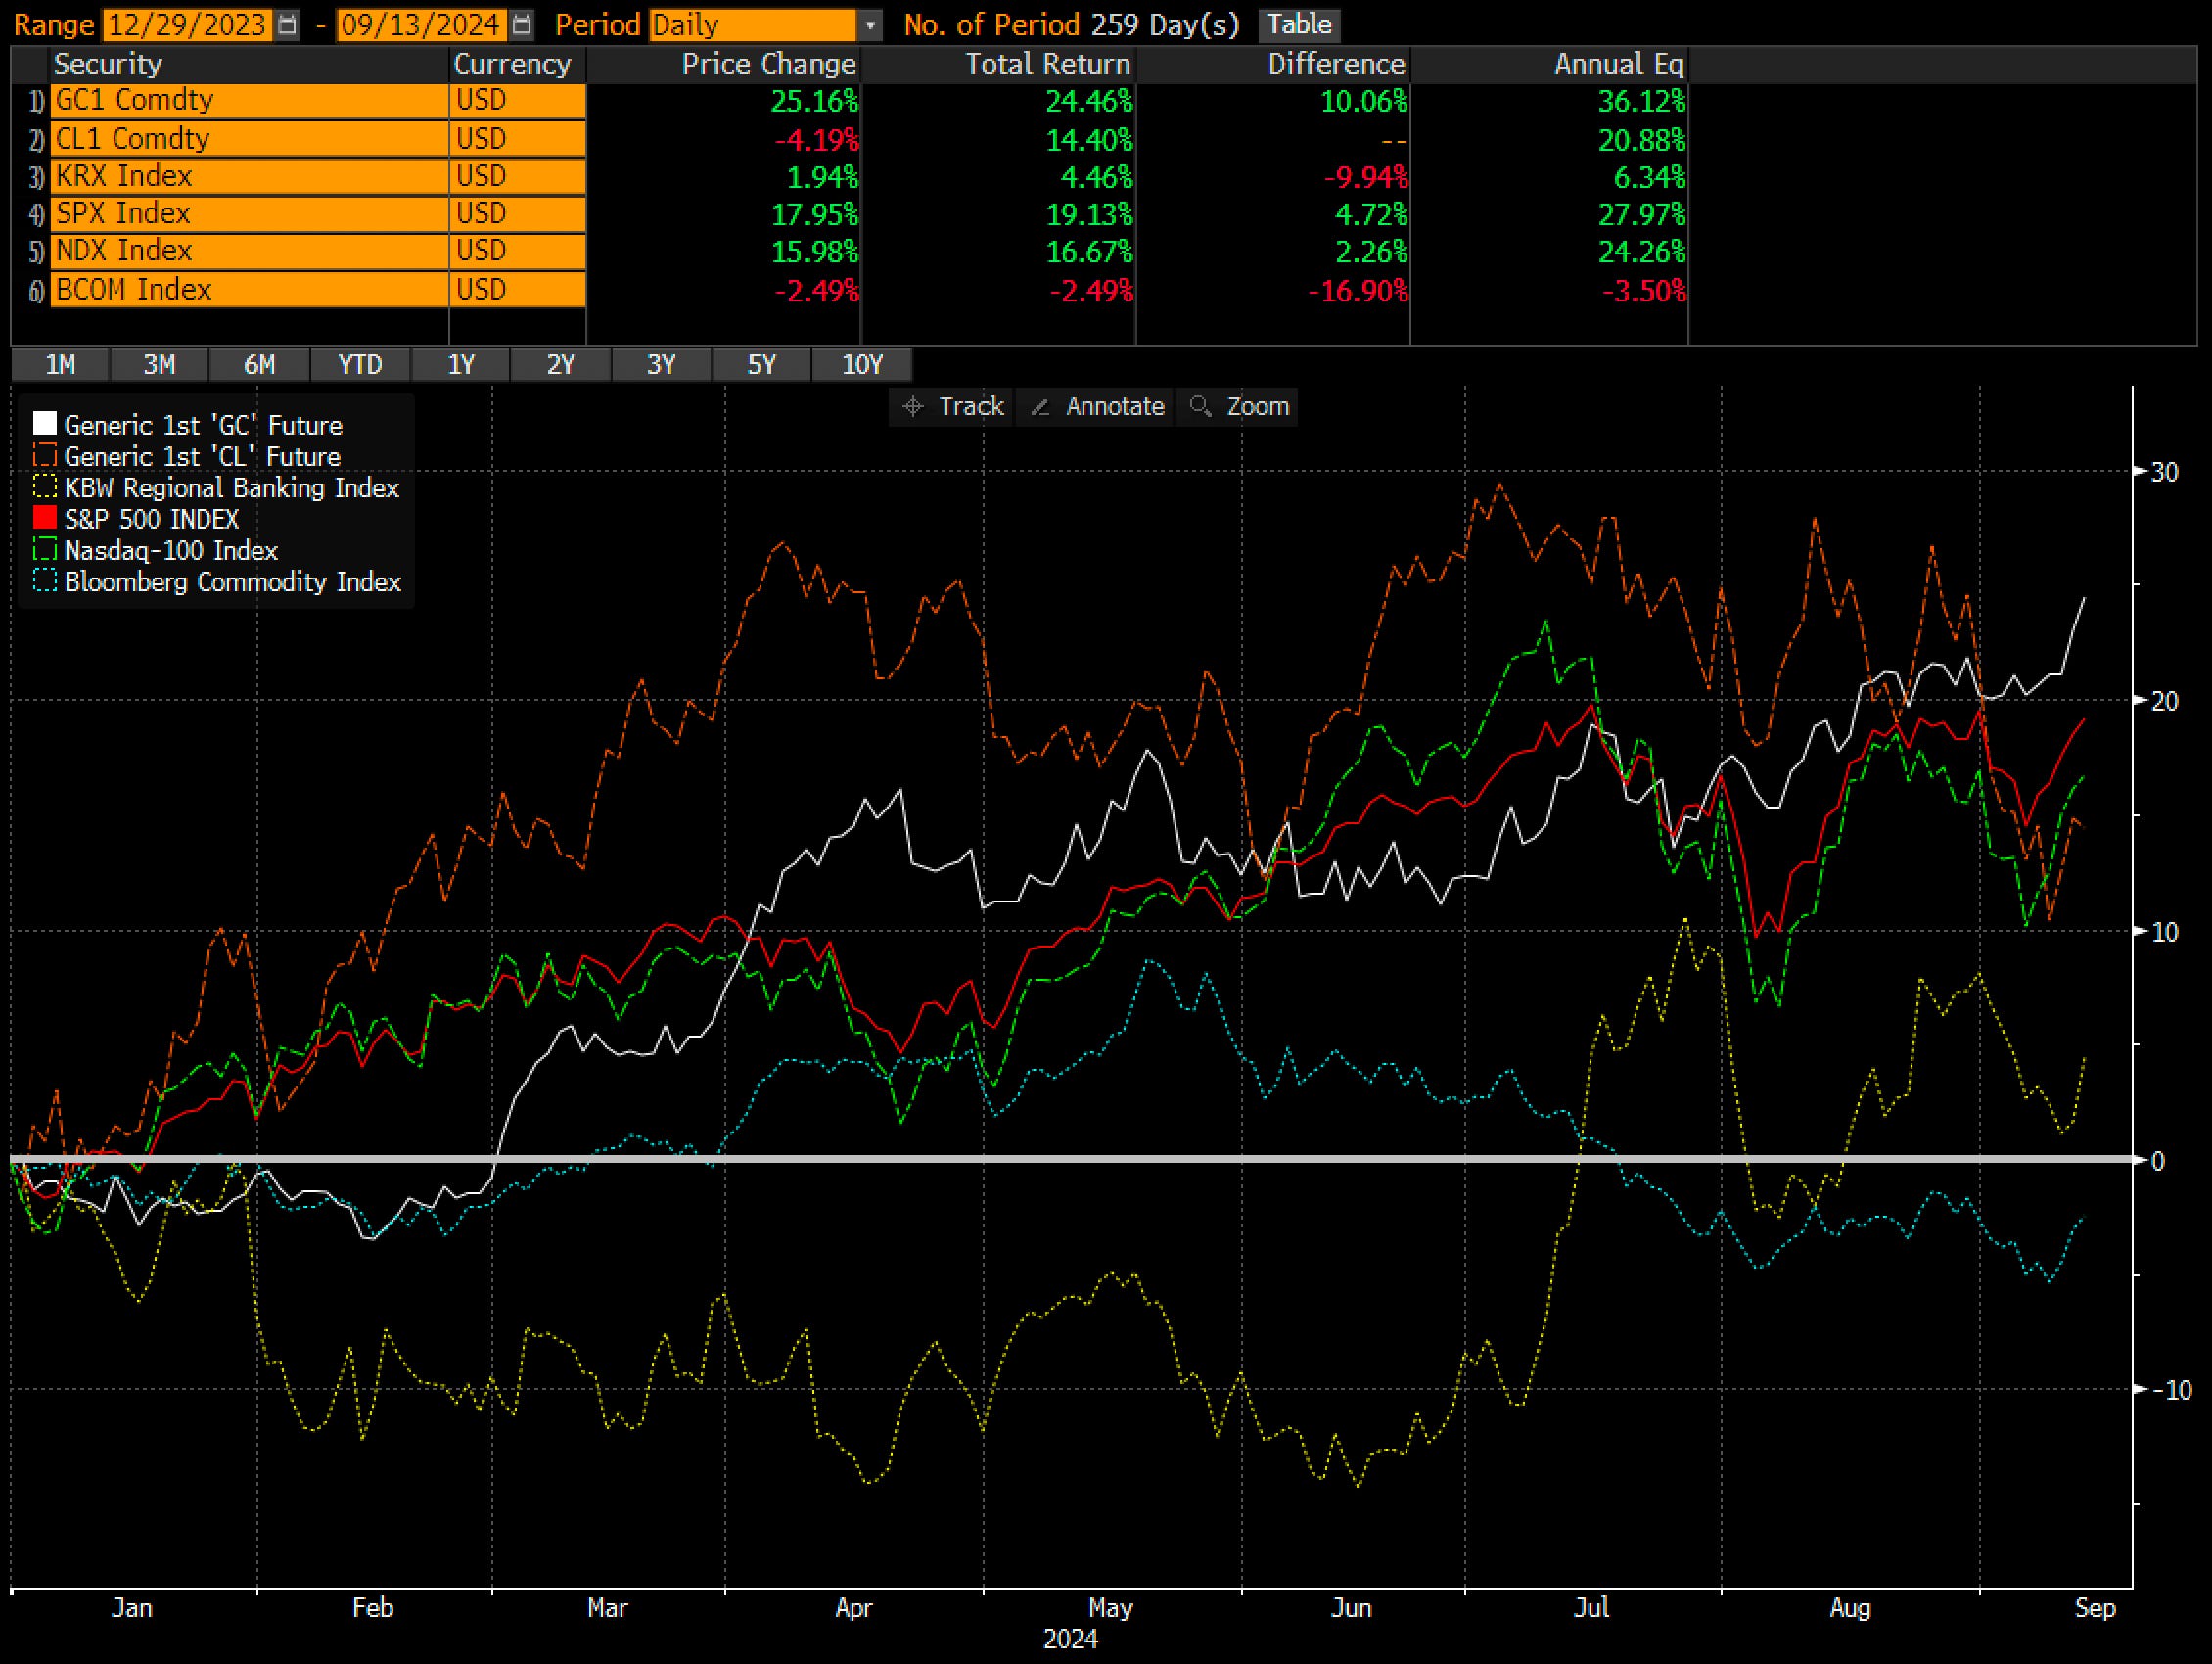
Oil and BCOM (commodities) basket has had a tough year after some good runs while inflation was running hotter. I personally wonder if there’s a chance that lower rates turn into a second wave of inflation further down the line. Historically two episodes of Fed cutting did just that.
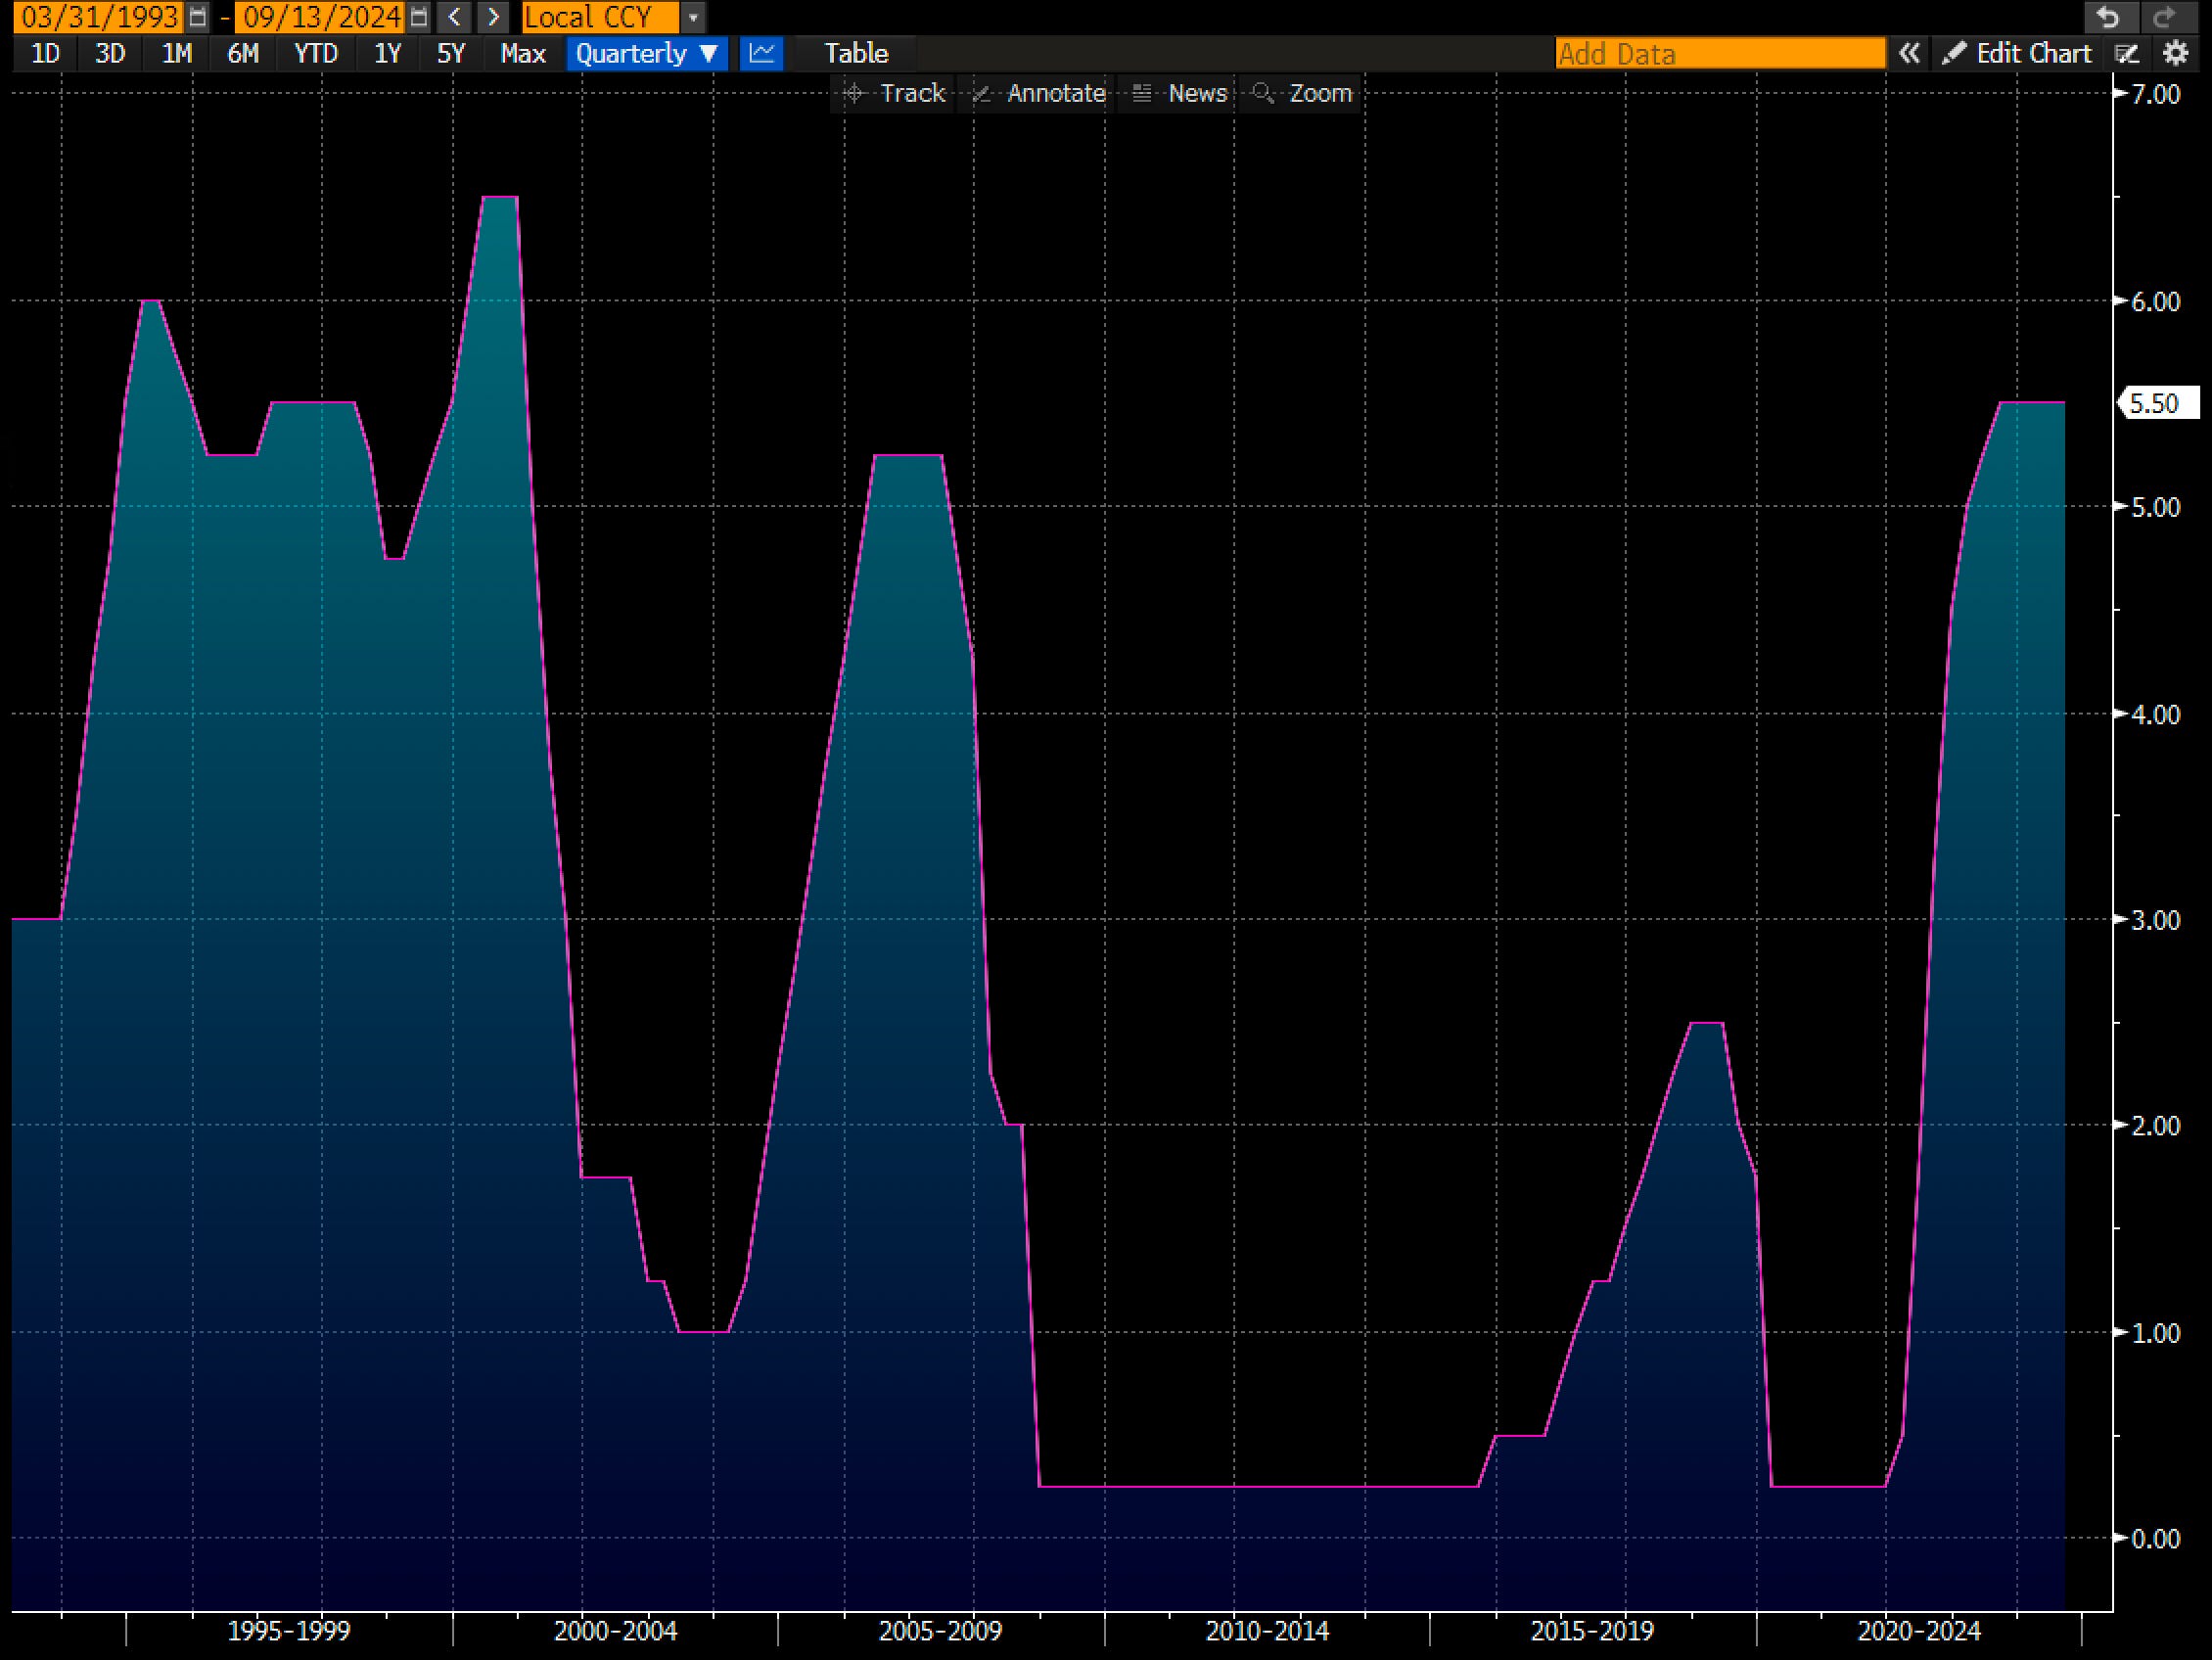
The 1970s Stagflation Era: During the 1970s, the Federal Reserve, under Chairman Arthur Burns, kept interest rates relatively low despite rising inflation. This was partly due to political pressure and a misunderstanding of the relationship between unemployment and inflation. The result was a period of "stagflation" - high inflation combined with slow economic growth and high unemployment.
The Early 2000s Housing Bubble: Following the dot-com crash and the 9/11 terrorist attacks, the Federal Reserve, led by Chairman Alan Greenspan, aggressively cut interest rates to stimulate the economy. Rates were lowered from 6.5% in 2000 to 1% by 2003. While this helped boost economic growth, it also contributed to the housing bubble and increased inflation in asset prices, particularly in real estate.
And there was also the mid 1990’s rate cutting cycle. I came across this graphic from MUFG showing major asset class performance in that environment, which was characterized by rate cuts and a soft landing. In that world commodities ending up outperforming all major asset classes.
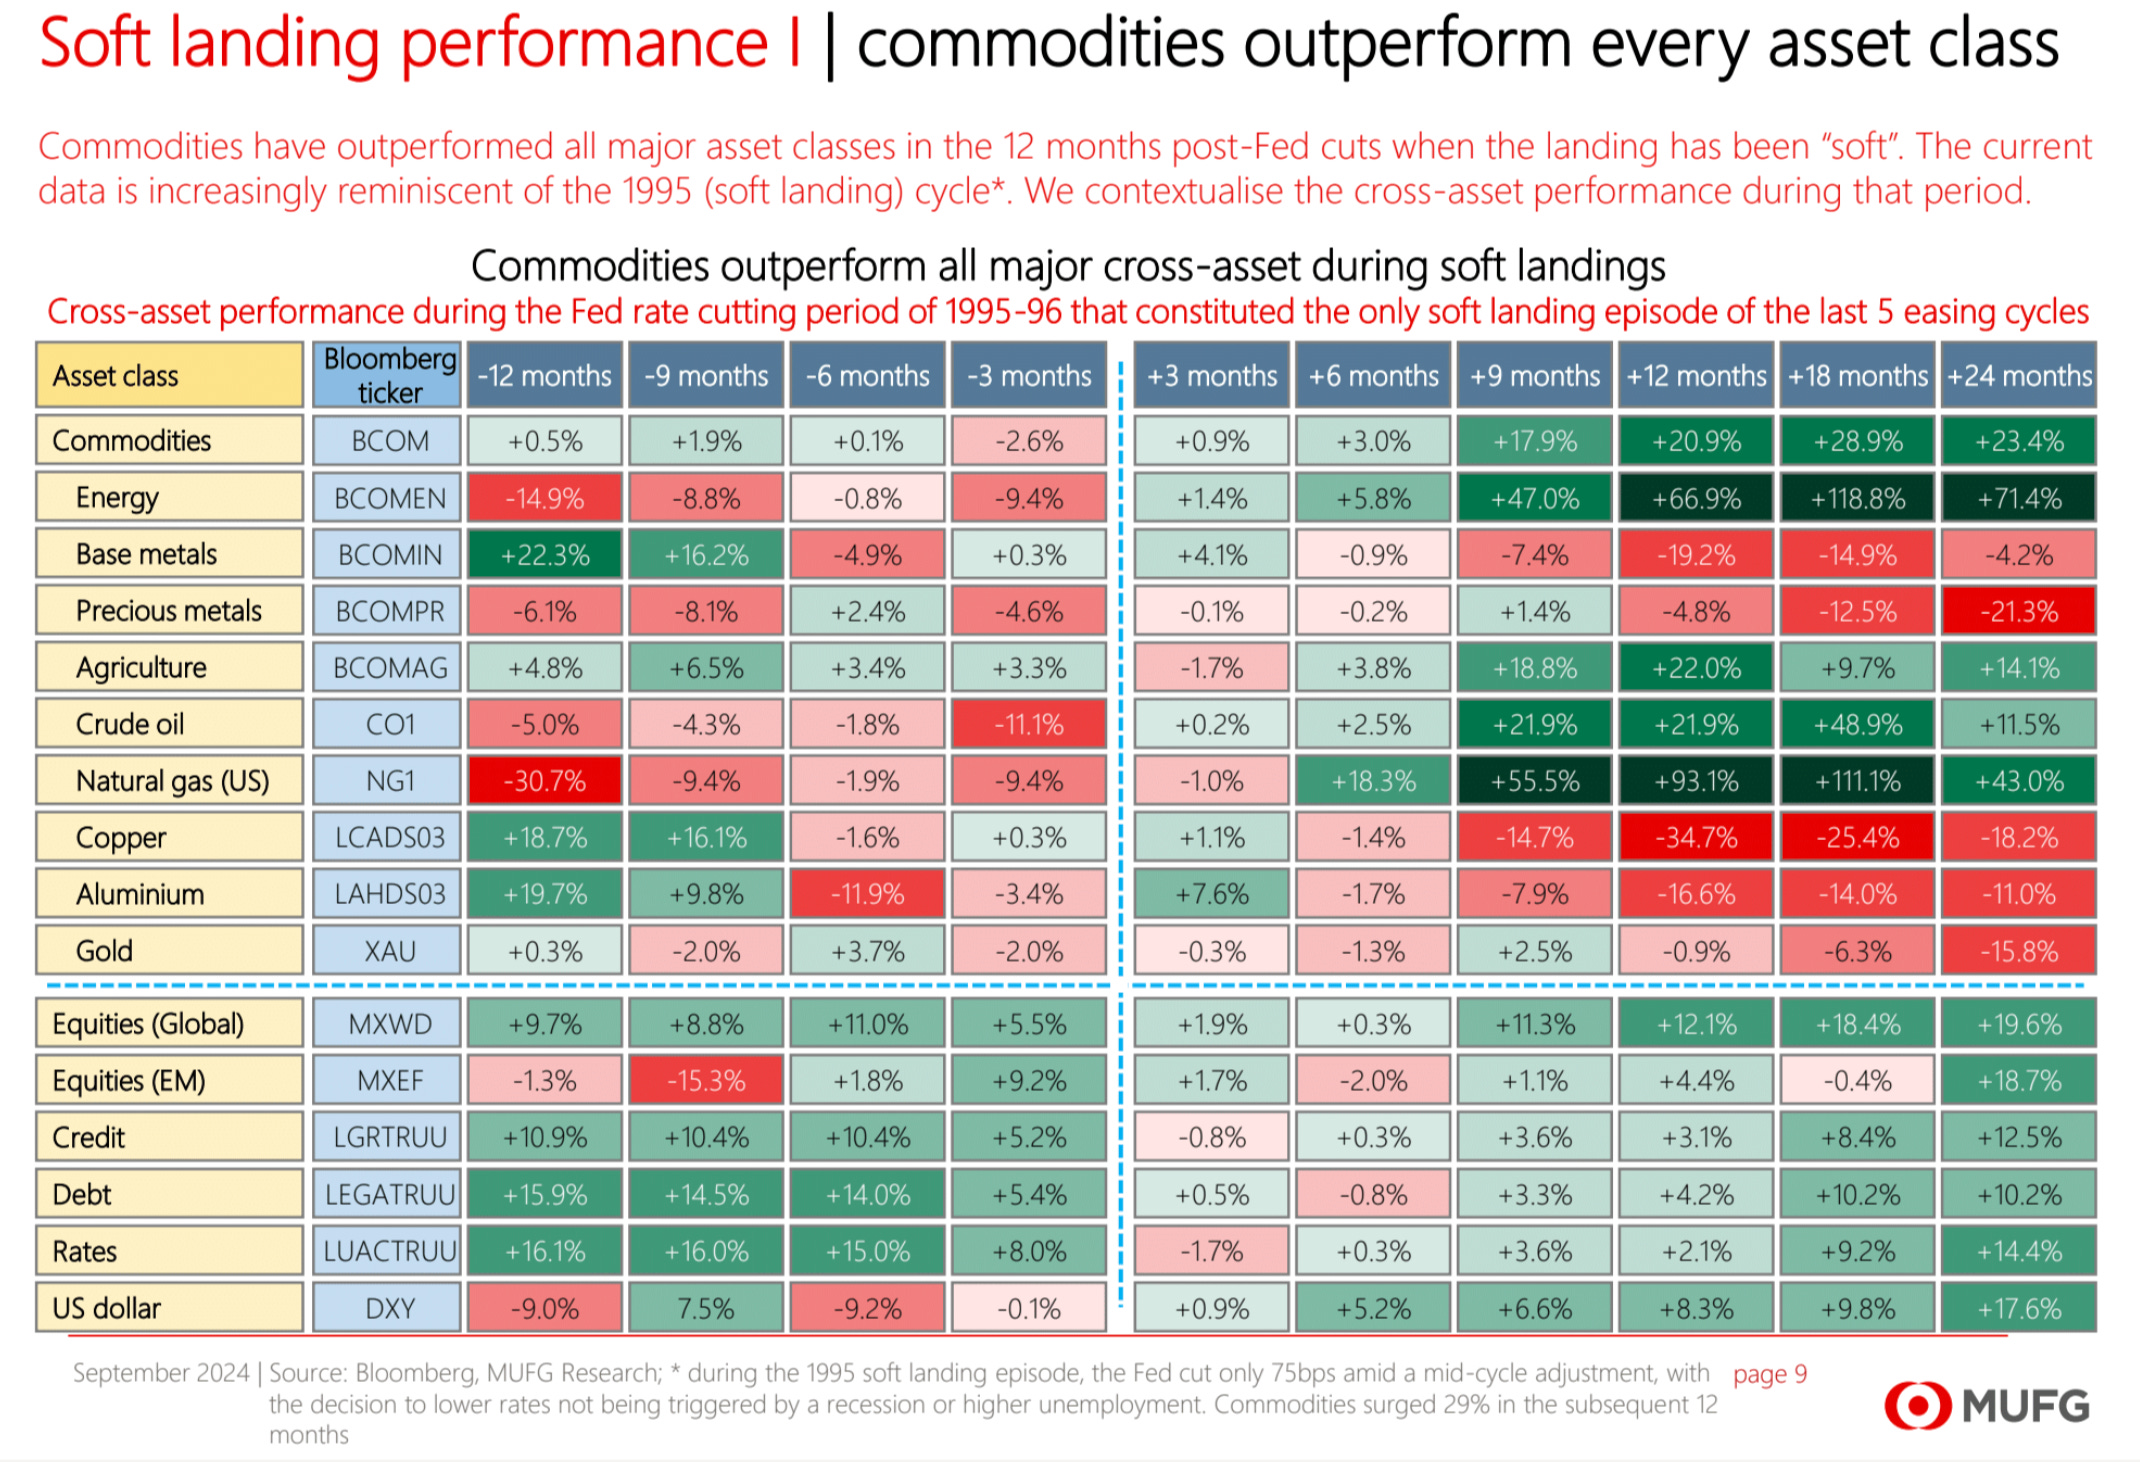
Funnily enough this environment in the mid to late 1990’s led to the eventual repeal of Glass Steagall (allowing banks to bet with retail money again) sowing the seeds for what eventually would become the Great Financial Crisis in the late 2000’s. Talk about Chaos Theory & Butterfly Effects …

The best is ahead,
Victaurs