Tldr: As a bank investor, other than deeply knowing a bank and it’s execs, the best thing you can do is know how well they grow core metrics like RPS, EPS, and TBVPS.
Framework & Importance of Growing RPS, EPS, TBVPS
Over the long run, companies that deliver above-average shareholder returns often exhibit growth in key financial metrics such as Revenue per Share, Earnings per Share (EPS), and Tangible Book Value per Share (TBV/Share). This correlation is rooted in the fundamental performance of the company.
When a company consistently grows its revenue, it indicates that it is expanding its market presence and generating more sales. This revenue growth, when managed efficiently, translates into higher earnings. As EPS increases, it signals to investors that the company is profitable and has strong future prospects. This, in turn, boosts investor confidence and drives up the share price.
Similarly, growth in TBV/Share reflects the company's ability to increase its tangible assets, which can be a sign of financial stability and long-term value creation. When all these metrics are moving in the right direction, it suggests that the company is not only performing well but also creating sustainable value for its shareholders.
In essence, the growth in these financial metrics is a testament to the company's overall health and its ability to generate returns for its investors. Over time, this performance is often rewarded with higher share prices, aligning the interests of the company and its shareholders.
Metrics up = stock price up. End of line.
If you want to read up on this from June in the U.S. here you go:
Relative Growth Scoring Model:
Quartile Performance Measurement:
For each bank, measure the performance of Revenue per Share, Earnings per Share (EPS), and Tangible Book Value per Share (TBV/Share).
Rank these metrics for each bank and divide them into quartiles.
Assign positive points for being in the top quartiles and negative points for being in the bottom quartiles.
Respect and understand that while not perfect, this will let you know how your bank has done.
Weighting Time Periods:
Consider the performance over 1-year, 3-year, 5-year, and 7-year periods.
Assign weights to these periods to reflect their importance. For example, you might give more weight to the 7-year period to emphasize long-term performance.
I chose to give more credence to 5-year, but the framework could be tweaked.
Tailwinds for Asset Sensitive Balance Sheets:
Understand that asset-sensitive balance sheets may have benefited from favorable conditions, such as rising interest rates, which can boost earnings and asset values.
Understand that this could lead someone to pick an asset sensitive bank into a rate cutting cycle (unless inflation picks back up?).
Use forward EPS projections & balance sheet insights to validate or test.
By analyzing these metrics and assigning points based on quartile performance, you can identify banks that consistently outperform their peers. This approach helps to highlight the correlation between strong financial performance and above-average shareholder returns over the long run.
The most obvious line in finance is past performance is not an indicator of future performance. But the most important line in finance is and object in motion tends to stay in motion. And so, a company that outperforms on core metrics should continue to outperform on core metrics.
The RGS Medians:
Looking at all banks these are the 25th, 50th, and 75th percentile boundaries. A great time for European banks given the rates up and benign credit environment.
Note: there is some currency/FX noise in countries not explicitly on the Euro. This is a reality and one I have chosen not to spend time normalizing, yet.
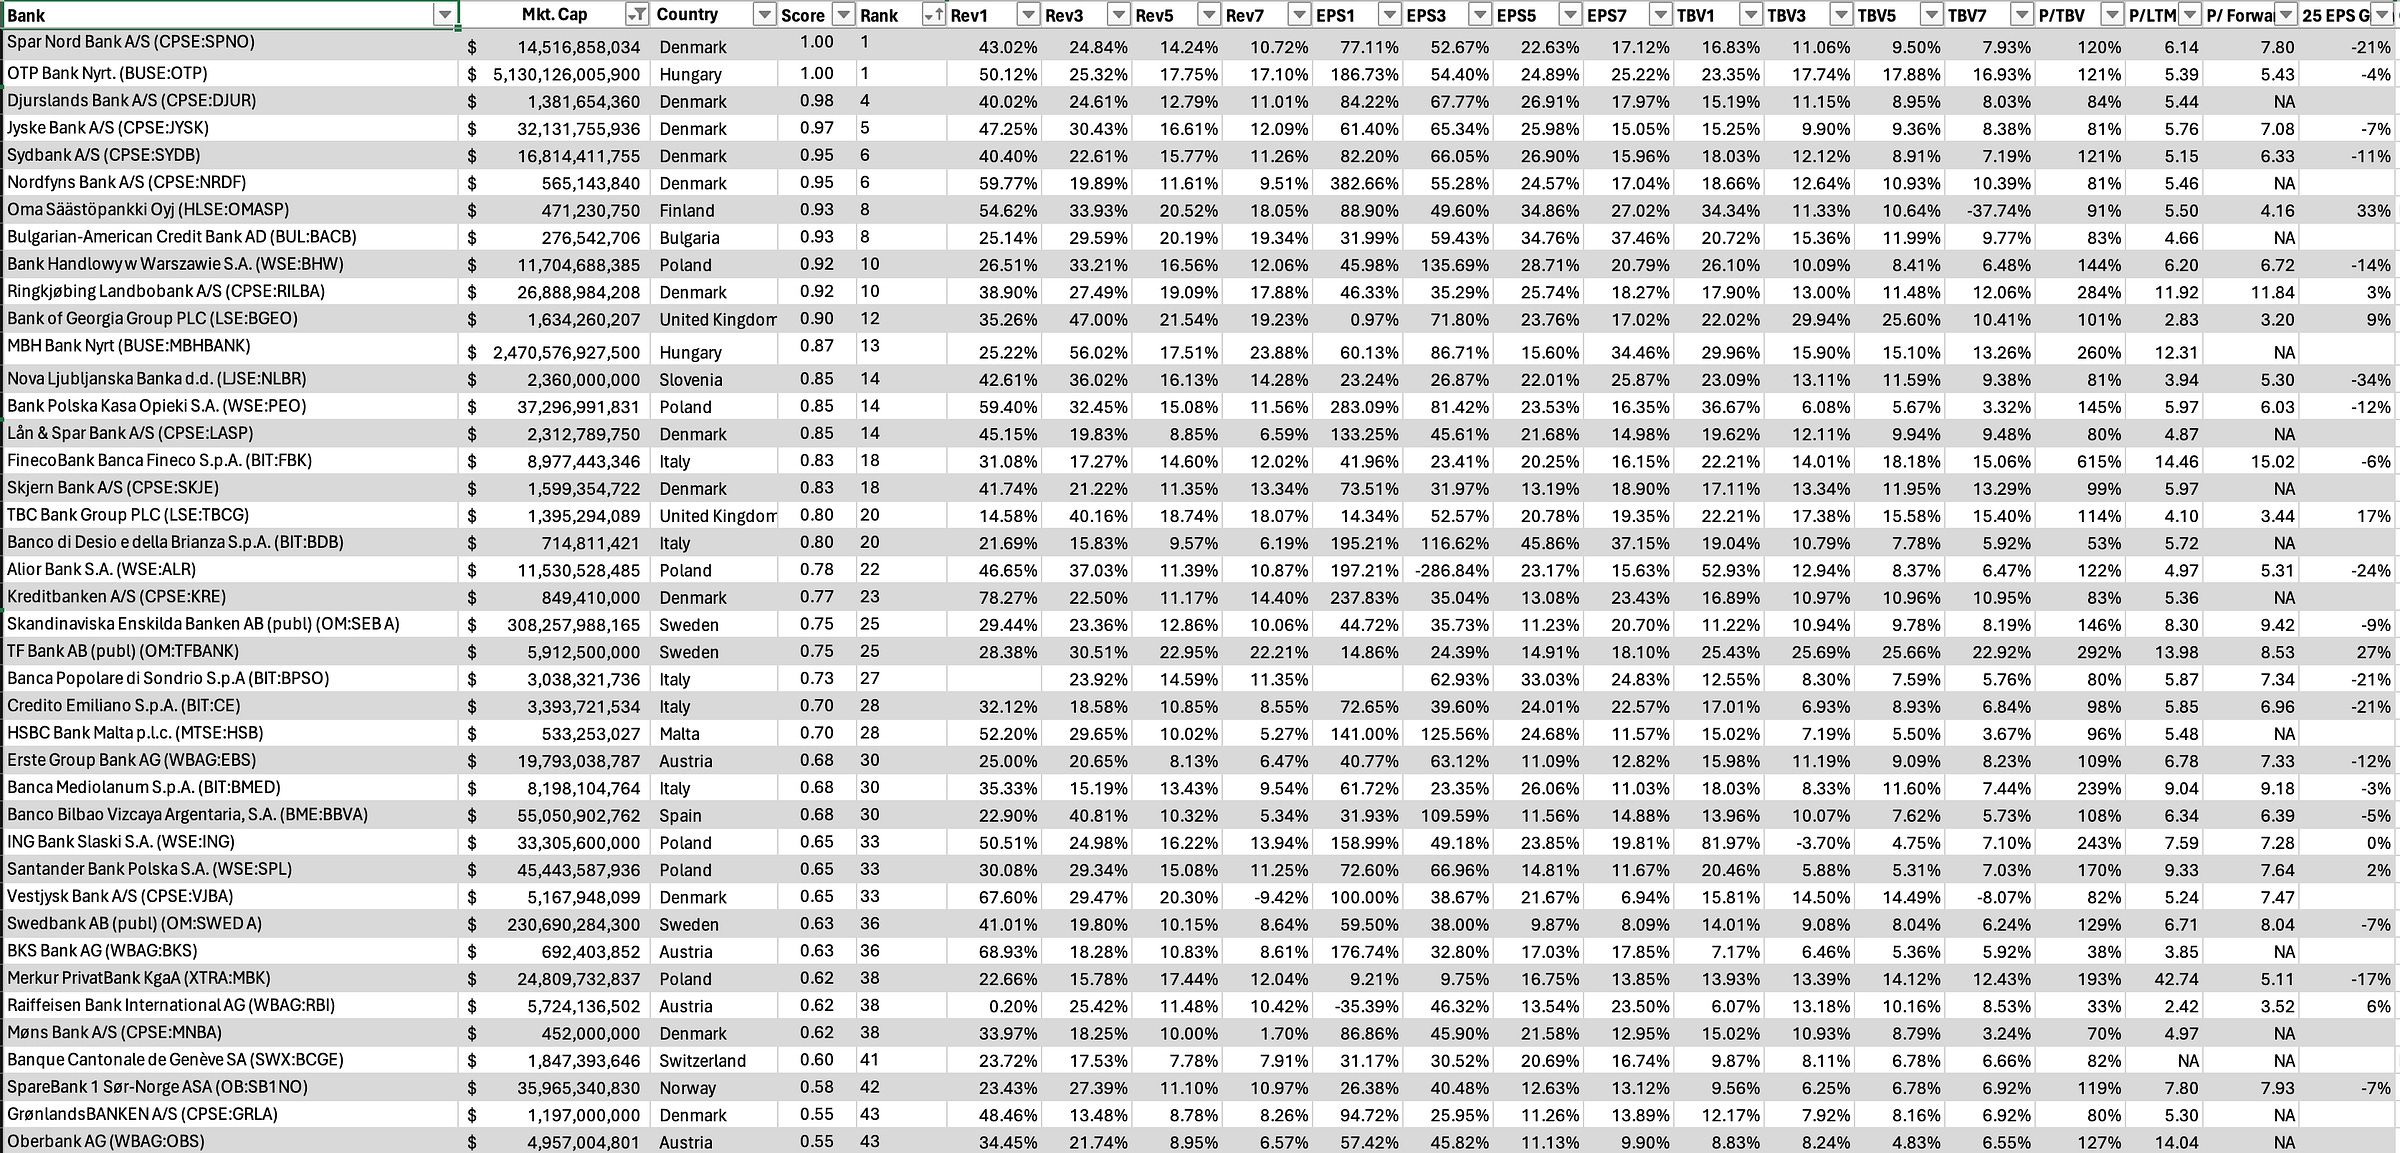
The Results of the Relative Growth Score
I’m going to start with all (if you’re a paid subscriber and want the sheet let me know) and then share what I think are useful idea generating cuts. I also cut off below small cap (local $250mm market cap).
For me, having a sense of past RGS rankings and then some valuation information plus ‘25 EPS expectations is how I build actionable ideas. I’ll start by including the RPS, EPS, and TBVPS, but then will cut those off to focus on key metrics and insights. I find the cuts to be more useful than the raw data and I hope that you enjoy. That’s the really good stuff.
And I hope that if you see anything worth looking at you hit up the chat:
All Europe RGS Screen - High to Low (The Guts of the Screen)
Keep reading with a 7-day free trial
Subscribe to Victaurs to keep reading this post and get 7 days of free access to the full post archives.


