Biggest Banks Update: New Relative Growth Rankings, Current ROTCE Scatter, & Some Go Forward Picks
Premium Member Deep Dive
As a premium member, you’re getting access to insights that go beyond surface-level analysis. Today, I’m unveiling the results of my proprietary relative growth rankings—a framework designed to pinpoint the movers and shakers among the biggest banks. This isn’t data you’ll find anywhere else, at least to my knowledge.
These rankings are reserved for those who demand more: more depth, more clarity, and a sharper edge in understanding growth and profitability dynamics in banks. In this update, you’ll see how the leaders stack up, explore a fresh ROTCE scatter that separates signal from noise, and discover my top 5 and bottom 5 picks in the biggest bank space.
Ready or not, here we go.
Big Banks First?
In the realm of big banking, there's no room for hiding behind liquidity quirks or artificial constraints. There is no finding an illiquid gem printing returns. This is a straightforward game of scale and foresight, where making the right calls on balance sheets defines your edge.
We’ll start with the 27 largest and most liquid U.S. banks—each with over $50 billion in assets. The challenge is to cut through the market noise and zero in on fundamentals. It's not about who made headlines last quarter; it's about dissecting structural strengths and vulnerabilities—growth potential, profitability, risk exposure—and anticipating how they'll perform relative to each other as economic conditions evolve.
Coming next will be all $500 million market cap banks layered in to give you a sense of the same numbers but for the larger universe. Banks are (to quote Mugatu) “so hot right now” and so you won’t want to miss that update given the flows rushing into banks. I’m told people like the smaller bank list even more since it uncovers pockets of discounted growth names that you can buy and hold on your way to bank alpha.
Rolling Forward Time
The time had come to roll forward the relative growth score analysis, one of the cornerstones of my framework for assessing the largest banks. This proprietary analysis measures the compound annual growth rate (CAGR) of three critical metrics: Revenue per Share (RPS), Earnings per Share (EPS), and Tangible Book Value per Share (TBVPS). By evaluating these metrics over 1-, 3-, 5-, and 7-year time horizons, the goal is clear—to identify which banks consistently outgrow their peers in building core value. Growth, is good.
With the release of Q3 2024 results, I’ve updated the data to capture the most recent LTM periods. These refreshed numbers provide a sharper lens on which institutions have delivered sustainable growth across varying market cycles. It's not just about short-term results but about uncovering long-term trends in profitability, efficiency, and shareholder value creation.
Remember, growth is a signal, and this scorecard tells us which banks have proven their ability to lead—and which ones are merely treading water.
Why does RPS, EPS, TBVPS Matter?
Revenue per share (RPS), earnings per share (EPS), and tangible book value per share (TBVPS) are the trifecta of value creation. Together, they reveal a company’s ability to generate, retain, and grow wealth for its shareholders. RPS showcases the strength and scalability of the topline, EPS highlights profitability and operational efficiency, and TBVPS reflects balance sheet discipline and long-term equity growth. In banking, where capital deployment and risk management drive results, excelling in these metrics isn’t optional—it’s essential. The best do it. The worst don’t.
It’s no coincidence that top shareholder return companies consistently demonstrate their ability to outpace peers in RPS, EPS, and TBVPS growth. These metrics are the bedrock of sustained compounding and shareholder value. They separate the market leaders from the laggards, delivering the long-term returns that investors chase. In short, if you want to find winners, this is where you look.
Survivorship Bias
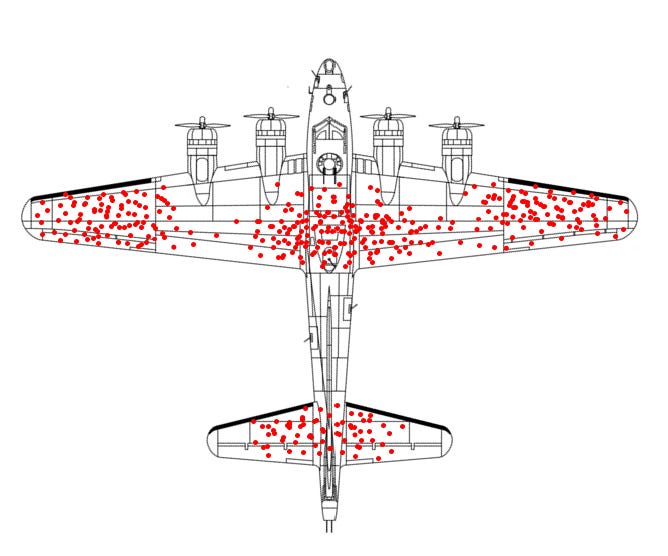
Analyzing RPS, EPS, and TBVPS growth is invaluable for identifying high-performing banks, but it comes with a critical caveat: survivorship bias. It’s like the famous World War II analysis of bullet-riddled planes returning from missions. The initial focus was on reinforcing the areas with visible holes—until someone realized the real lessons lay in understanding where the planes that didn’t return were hit. See below to catch my drift. PS - thanks again Ken King.
In 2022, three high-growth banks—SIVB, SBNY, and FRC—became cautionary tales for focusing on growth only. Their impressive growth metrics masked underlying vulnerabilities that ultimately led to their failure. Ironically, the very qualities that propelled their rapid growth may have amplified their exposure to risks they couldn’t manage. This underscores a key point: identifying winners isn’t just about spotting who grows fastest—it’s about knowing who manages risk best. One could argue that all three management teams did not respect the risk side of the equation, and it caused them to become fragile with too much growth.
Sustainable growth is a balancing act. True leaders don’t just outgrow their peers; they do so while maintaining discipline, resilience, and the ability to weather uncertainty. In the world of banks, it’s not enough to track who flies high—you must also understand who’s built to land safely.
Now onto the meat of the article. Premium subscribers time for us to dig in …
Q3 2024 ROTCE & TBV Scatter Plot
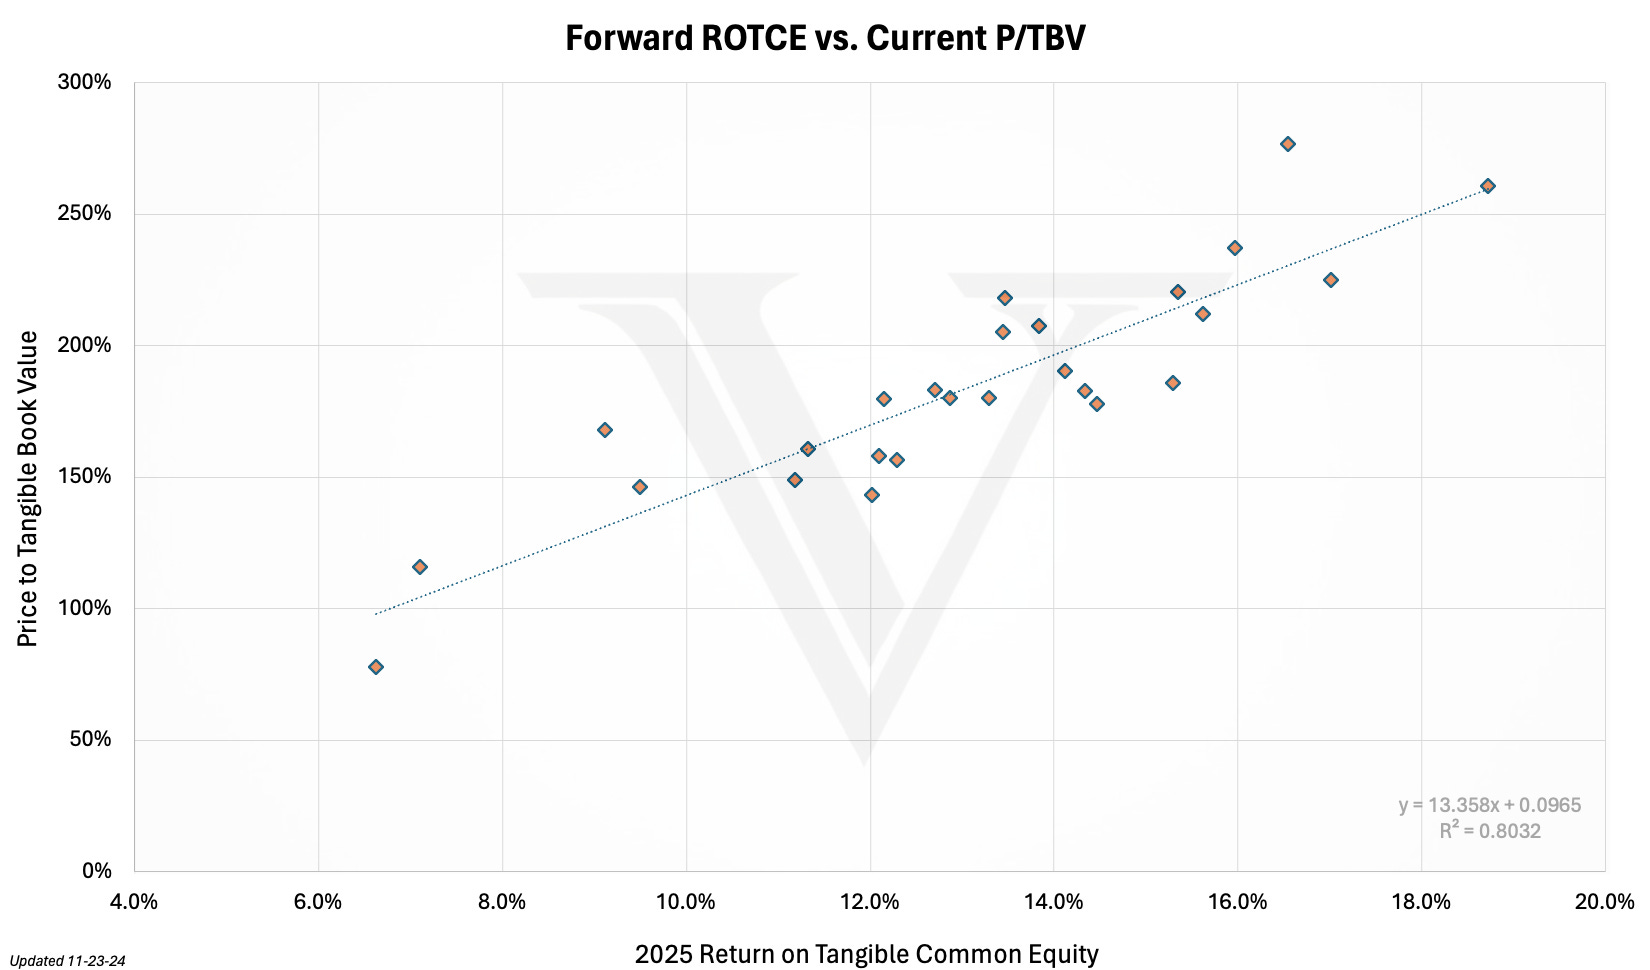
Return on tangible common equity (ROTCE) and price-to-tangible book value (P/TBV) are deeply connected because ROTCE reflects how effectively a bank generates returns on its tangible equity, while P/TBV measures how much investors are willing to pay for that equity. Banks with consistently high ROTCE typically trade at higher P/TBV multiples, as investors reward their ability to convert equity into profits efficiently. This relationship is crucial because it ties operational performance directly to market valuation, helping investors identify which banks deliver the best balance of profitability and value creation.
A 10% ROTCE is currently valued at roughly 150% of TBV—elevated by historical standards, but not outrageous. For perspective, during the go-go days of 2003-2006, a 10% ROTCE often commanded 200% TBV or more. There’s a decent correlation here for the stats crowd, but let’s not forget correlation is not causation. Valuations reflect more than math—they’re a story of sentiment, risk, and the ever-shifting expectations of the market.
Part of the reason of this raising of the valuation floor (P/TBV and P/E multiple) is the prospect of higher rates, a more sloped yield curve, less regulation, more M&A, and generally a friendlier environment to banks.
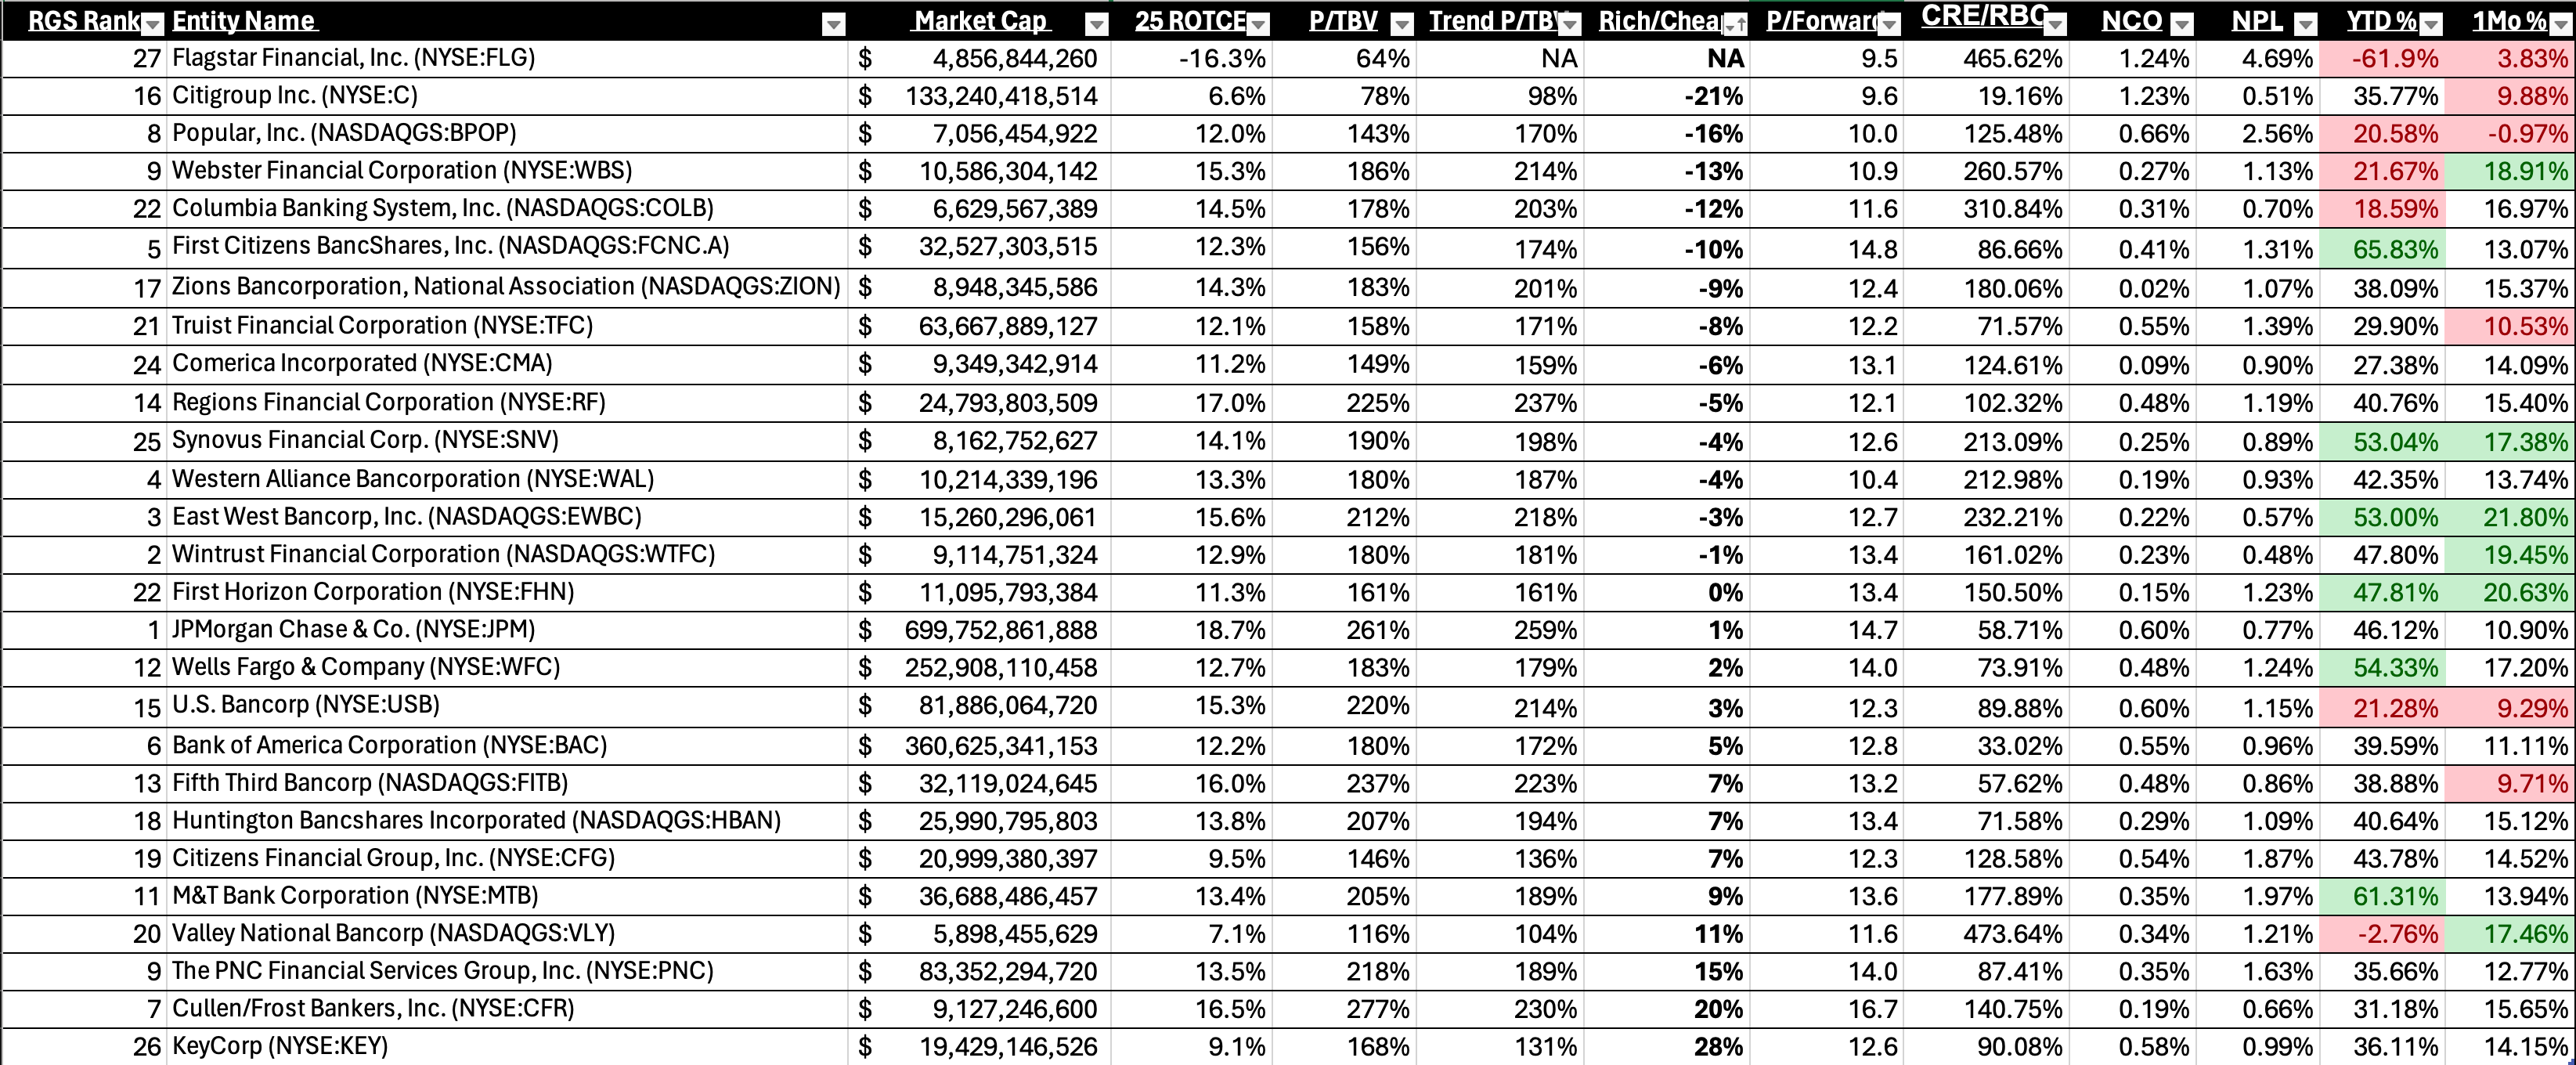
Below is the listed rundown of the cheapest banks relative to trend-implied P/TBV. Keep in mind, forward ROTCE is shaped by a mix of factors—interest rates, credit quality, expense management, and the broader macro economy. Current NCO and NPL figures are based on the most recent quarter, but I’ve found it equally critical to track YTD and 1-month price performance as barometers of shifting investor sentiment.
Take a closer look at how some names—like C, BPOP, FLG, TFC, USB, and FITB—have been left behind, while others, like VLY, are showing mixed signals: a strong 1-month rally but still lagging YTD. Then there are names like SNV and FHN, which stand out for their surprisingly solid runs in both YTD and 1-month metrics.
At the end of the day, buying a bank (in this space) is a function of handicapping whether or not you think they can achieve 2025’s returns, what investors think their odds of achieving them are (multiple), and at least for me, how bulled up or beared up investors are on the name (vibes). I don’t think I’m missing anything fundamentally, although each one of those three involved tons of moving parts.
As a point of principle, the top performers in ROTCE for 2025 come with lofty valuations, and for good reason—they’ve earned their place at the top. But if I had to pick one of these high-fliers that might stumble, my bet would be on Regions. The dynamics aren’t working entirely in their favor. Call it intuition though and I am not short the name. That said, if I were forced to choose between these five names on the long side for the next 12 months, my focus would narrow to FITB or CFR. Both offer a compelling blend of performance and potential, making them the standout plays in an elite but pricey field. EWBC on the other hand I love them, but they’ve come pretty far pretty fast over the past year and past month with people rushing to buy them.
The Growth Score Framework
Moving onto the Relative Growth scoring system, it evaluates banks based on their Revenue CAGR, EPS CAGR, and TBV/S CAGR across 1-, 3-, 5-, and 7-year time horizons. Banks are ranked into four percentile ranges—0–25%, 25–50%, 50–75%, and 75–100%—based on their performance for each metric. Scores are then assigned to reflect their relative position: top performers in the 75–100% range receive the highest scores (+1 or +2), while the lowest performers in the 0–25% range are penalized with negative scores (-1 or -2). Middle tiers receive moderate scores to reflect their position, with 25–50% slightly negative (-0.5) and 50–75% slightly positive (+0.5 to +1).
By analyzing growth over these time horizons, the system provides a structured way to compare banks based on their ability to generate, sustain, and grow value across key financial metrics. It rewards consistent high performance while penalizing weak or volatile growth trends, offering a clear framework to identify which institutions are positioned to lead in shareholder value creation. For lack of a better term, this gives me a sense of if I can “trust” management to produce the things I care about.
The table below are the percentiles for each main category.
Rolling Forward Time Horizons
It was long overdue, but I updated the scores to include most recent financial data. And for previous time periods I took LTM as of that date (at least with RPS & EPS) in an attempt to smooth things out.
To point out some stats on those 1-, 3-, 5-, and 7-year time periods:
Q3 2023 to Q3 2024
A year marked by easing rates, the Fed Funds Rate dropped 50 basis points, and the 10-Year Treasury Yield fell by 90 basis points, while the 2s10s yield spread widened by 60 basis points. KRE surged, delivering a remarkable and annualized 42.28% return, outperforming SPY (+36.00%) and QQQ (+37.92%). Rates down was kind to TBVPS for some banks.
Q3 2021 to Q3 2024
Over three years, a sharp 475 basis point increase in the Fed Funds Rate and a 150-basis point rise in the 10-Year Treasury Yield compressed margin/earnings, and a flattening/inverted yield curve as the 2s10s spread dropped by 110 basis points. The impact was harshest on KRE, which posted annualized -3.32% returns, lagging behind SPY’s modest +10.61% and QQQ’s +10.32%. Rising rates exposed vulnerabilities, particularly in regional banks, while broader indices weathered the storm.
Q3 2019 to Q3 2024
Five years of shifting financial conditions saw the Fed Funds Rate climb 300 basis points and the 10-Year Treasury Yield rise 230 basis points, with the 2s10s spread widening by just 2 basis points. KRE eked out a small, annualized gain of +4.31%, well behind SPY’s +15.94% and QQQ’s +21.87%. The modest returns for regional banks in this period underline the challenges of sustained growth amid steady rate hikes.
Q3 2017 to Q3 2024
Across seven years going back to the Trump 1.0 era, the Fed Funds Rate rose by 375 basis points, the 10-Year Treasury Yield climbed 150 basis points, and the 2s10s spread fell by 71 basis points. KRE managed a muted annualized +2.85% return, dwarfed by SPY’s +14.44% and QQQ’s +19.79%. The prolonged tightening environment tested banks’ ability to manage growth and profitability, as broader indices benefited from diversified economic drivers.
These time periods are all “rates up” periods except for the last year. Keep this in mind.
The RGS Rankings
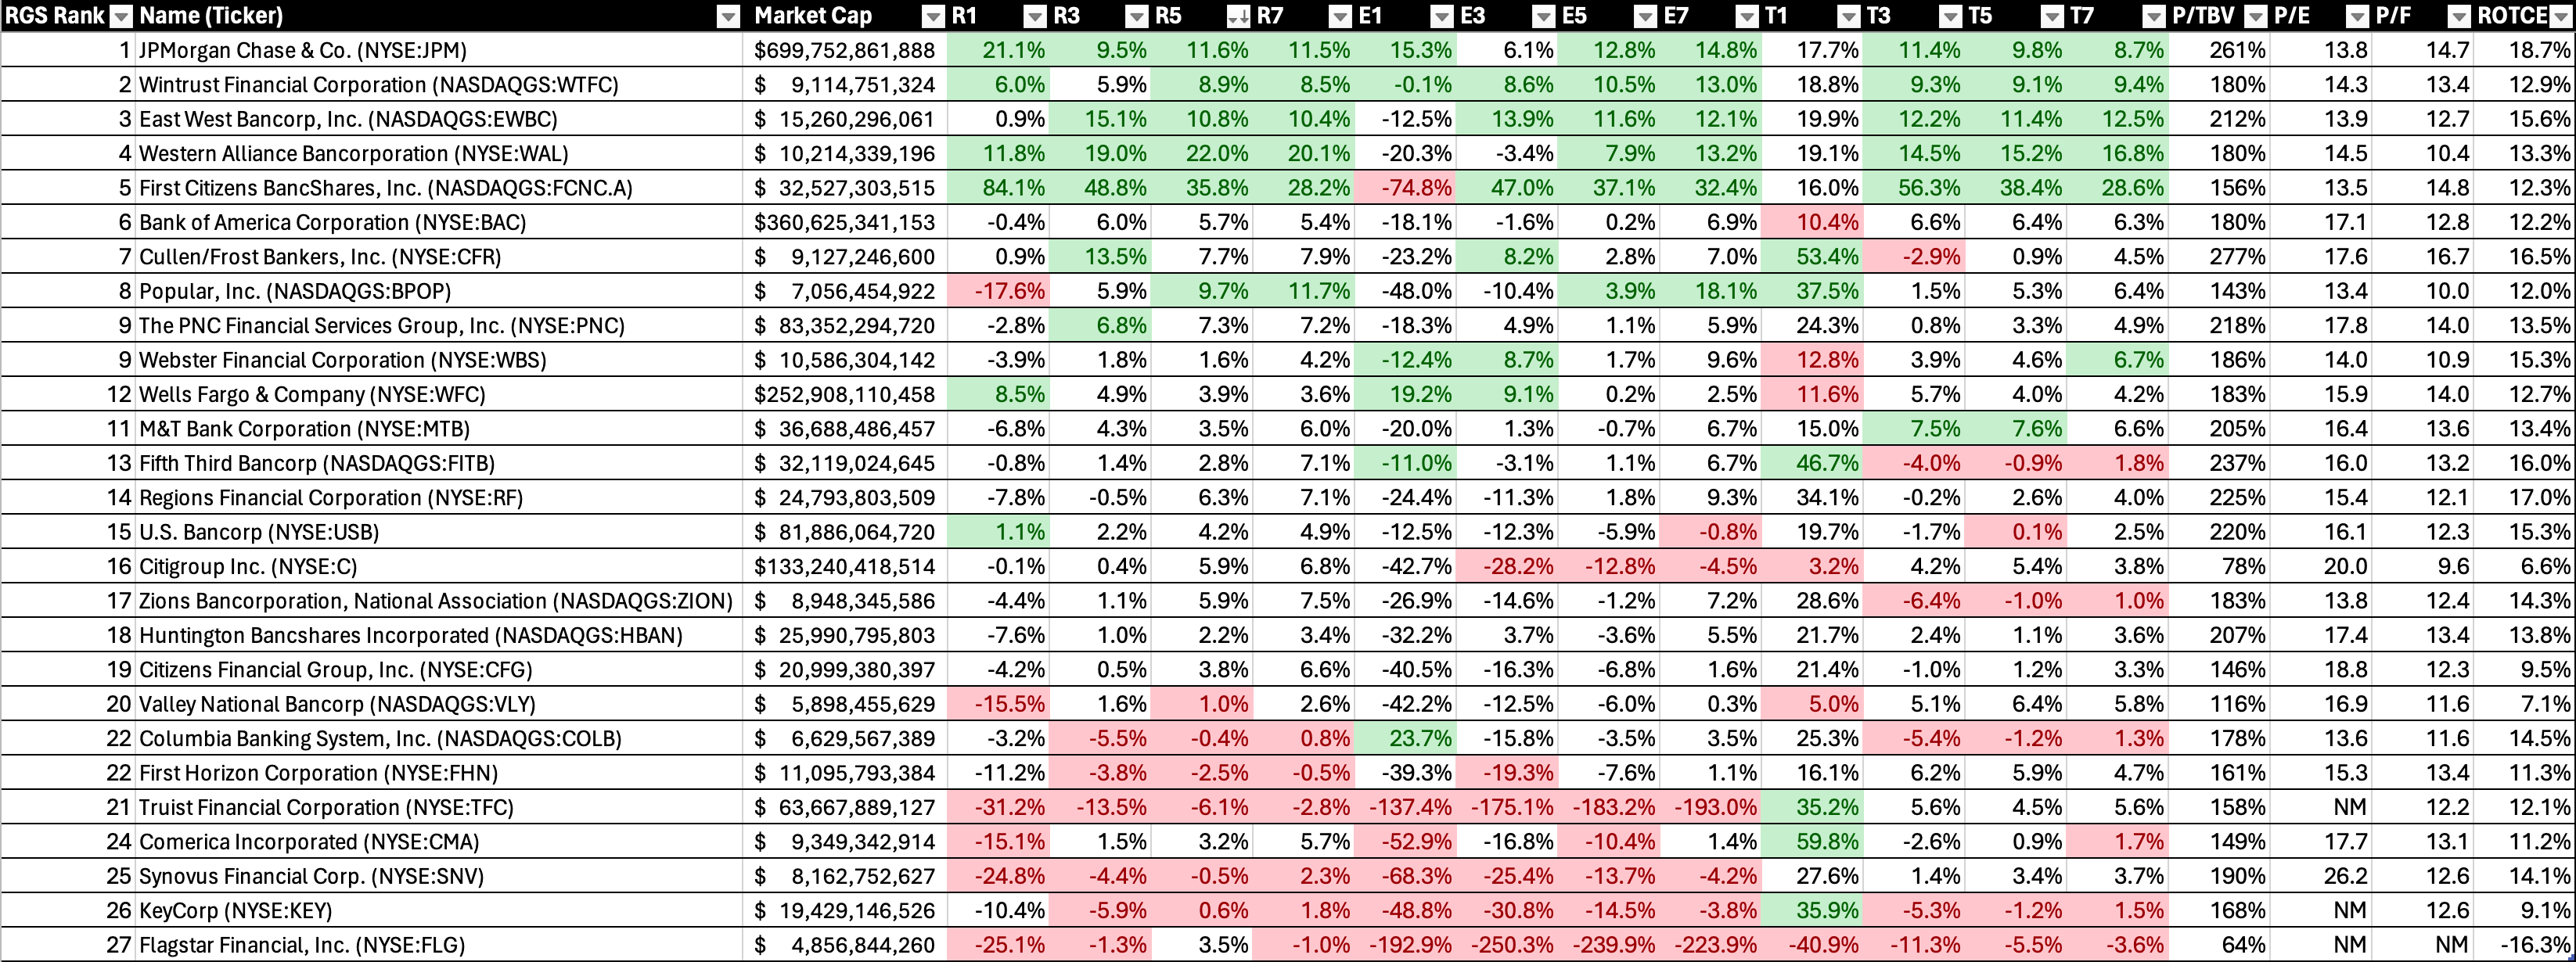
Without further ado, here they are. The full rankings are below, and you can use the raw data to pick time horizons and metrics you care about most. For me, I care about all, and I care about where the market is pricing these names considering rear view and forward-looking returns.
JPM continues to amaze but I wonder what “After Jamie” looks like
WTFC has quietly built a powerhouse
WAL refuses to stop growing, no matter the challenges thrown its way.
No failure deals on the horizon, but FCNC.A is pretty amazing.
BAC ranked a lot higher than I thought.
CFR no surprises there, they’re a really solid expensive bank.
BPOP had surprisingly good EPS growth.
C has had a surprisingly bad run of EPS growth.
I can’t trust ZION given the longer term TBVPS growth.
COLB suffering from M&A hangover.
CMA ate it badly into the rate rise.
KEY same thing but now has its Canadian capital infusion.
SNV is odd given its recent run up and score.
TFC is everyone’s punching bag lately.
Ranking By TBVPS
The ability to consistently grow tangible book value per share (TBVPS) over the long term is the ultimate measure of a bank's quality and management discipline. TBVPS is the foundation of shareholder value—it reflects how effectively a bank builds equity after accounting for risks, expenses, and returns. A bank that steadily grows this metric through various economic cycles signals more than just profitability; it signals trust. Trust in their ability to allocate capital wisely, manage credit risk prudently, and navigate shifting market conditions without compromising the balance sheet. Long-term TBVPS growth tells you that a bank doesn’t just survive; it thrives. These people below can be trusted with your capital (in my opinion).
The first is sorted by the long run. FCNC.A, WAL, and EWBC have shown an ability to compound & grow TBVPS over the long run. Buy these names on pullbacks. And shoot, maybe buy any of the top 7 on pullbacks. They have proven an ability to manage risk and grow what matters.
And the sort below that is the people that had the biggest balance sheet swing, I use this as a cheat sheet for people that are most positioned for rates down given the rate rally over the past 12-month time period. Those look like CMA, FITB, KEY, and TFC. It’s interesting to see how being caught very wrong footed can damage growth rates over the longer period in all of these names.
Ranking by EPS
Earnings per share (EPS) growth over the long run is the ultimate testament to a bank’s ability to deliver for its shareholders. Consistent EPS growth reflects disciplined management, operational efficiency, and a knack for navigating both opportunities and challenges. It means the bank isn’t just growing revenue but converting that growth into tangible profitability—through smarter expense management, effective capital deployment, and sound risk controls.
Banks that deliver steady EPS growth over time can be trusted because they’ve shown they can adapt. They’ve proven they can weather rate cycles, credit fluctuations, and macroeconomic turbulence without sacrificing returns. More importantly, it signals that management has aligned itself with shareholder interests, building not just equity, but also the confidence that comes with a proven ability to compound earnings year after year. In the end, long-term EPS growth is the mark of a bank that doesn’t just perform—it delivers. Shorter term reflects some deal activity, or continued asset sensitivity (like in JPM).
BPOP was surprising to me on this list of names, at least in terms of their ability to produce longer term EPS growth. For the math majors, compounding anything at 15% a year gives you a double in 5. And it’s important to consider the fact that the period from 2017 to today was in fact a rates up, so there is some bias towards names that are asset sensitive. This is an often missed point.
Looking Forward & Picks
Over the next 18 months, I foresee a landscape of generally stable rates paired with real GDP growth—not runaway inflation. The yield curve will likely remain modestly sloped, creating an environment where balance sheet positioning matters more than ever. Credit conditions should remain benign, with ongoing “whack-a-mole” episodes in commercial real estate highlighting isolated weaknesses rather than systemic risks. On the political front, Trump adds a layer of volatility that can’t be ignored, making tactical agility and risk management critical for navigating the road ahead.
In terms of go forward picks, I’m not short any banks. The flows are strong. The technical are strong. And until you see a reversal, it pays to stay long. That being said here are the names I favor.
Long FCNC.A: A name with serious optionality. Their VC exposure and aggressive stock buybacks position them as a leader if another large failure deal materializes—they’d be first in line to capitalize.
Long BPOP: A compelling long-term growth story trading at a discount due to revised guidance. With a strong CET1 buffer, they could ramp up buybacks, and their access to the pharma/biotech sector presents untapped upside, particularly if more business migrates from China.
Long C: The ultimate value play. Citi is cheap because no one trusts their ability to cut expenses, and Jane Fraser remains under pressure. But with potential regulatory easing, they stand to gain the most.
Long WTFC: A proven performer with long-term excellence. Their strategy of consistent acquisitions and growth remains intact.
Long TFC: It’s everyone’s favorite punchline right now, and they know it. But with rates trending down, they could benefit more than most, making the contrarian case compelling.
Long WAL: If we’re shifting to an environment where growth is rewarded, you want a bank that can grow. WAL is that bank.
Fade SNV: Despite a strong run-up, this name has always been tricky for me to profit from, so I’m staying out.
Fade ZION: A great footprint consistently mismanaged. Their track record of fumbling keeps me cautious.
Fade VLY: The risk of “one-off” CRE issues and their open admission of being equity sellers at current prices are red flags. Or at least yellow flags.
Fade HBAN: They’ve led on recent growth, but with curing credit conditions, others are likely to catch up. Their high expectations make them vulnerable to underperformance.
Fade RF: Nothing other than pure gut. Credit has been “too good”. Adjusting for AOCI CET1 is thinner than most would prefer too.
Next week is the fuller list.
The best is ahead,
Victaurs
PS - if you like this analysis, share it with a friend. I appreciate you all.


