


Bank 2025 Est. ROTCE & P/TBV Scatter
Panning for winners, avoiding expensive losers, & some names that will continue to confuse everyone. Plus: no sell side firms do this for the whole universe.

Why This Is Important.
Bank investing is weird.
You have companies that practice one of the oldest professions in humankind (lending money), that are slow growers relative to the rest of the investing world (5-10% EPS growth in any given year is considered outstanding), and that trade with relatively boring valuations (8-12x earnings and rarely above 200% of TBV in good times).
They are regulated more than almost every other industry. They have funding sources (retail depositors) that can literally leave in a second. And they operate on high amounts of leverage (12 to 1 is the norm for now coming off pre-GFC’s 20-1 or more).
Put that all together and you have a recipe for returns if you know what you’re doing, or frustration & losses if you don’t.
This scatter (along with my Growth Score) is made for bank investors that don’t want to pay too much for a lemon or miss a cheap winner.
ROTCE & Valuation Link.
A rule in bank investing is don’t pay too much today for tomorrow’s earnings. This is especially tough when tomorrow’s earnings are highly uncertain in a world where rates have gone up 500bps and credit has barely moved off of all time low losses.
Another rule is to figure out whose earnings are reliable or dependable into the future. Track record is one way to do this (i.e. Growth Score). Talking to management and/or reading call transcript tea leaves is another. But the end goal is to buy reliable managers & balance sheets. Sell or fade the questionable ones.
A last rule is to buy banks where longer-term fundamental value is being mispriced. Fundamental value being a bank’s ability to drive returns no matter what happens to interest rates or the broader economy. This is often the most challenging rule because longer term fundamental value (and earnings) can move around a lot given the high amount of leverage on a bank balance sheet.
The ROTCE & P/TBV scatter is an attempt to address these three rules above.
This scatter should answer, what is a specific ROTCE is “worth”? Names trading at a substantial premium to tangible book value imply that investors believe these banks will outearn their cost of capital into the future. Names trading at a substantial discount to tangible book value should (in the eyes of the market) underperform their cost of capital into the future.
This scatter is important because it will lead you to ask questions like, “why in the world are people paying so much for such low future returns”.
And this scatter is important because it will lead you to great longs and great shorts.
Note: the information below is for public banks with ‘25 estimates & price to tangible book was from the last week of May - which is ironically flat to where we are today). Also note, 2025 EPS & TBV estimates are notoriously imperfect, but again this is a means to orient.
Q1 2024 Scatter Plot: Est. 2025 ROTCE vs. P/TBV
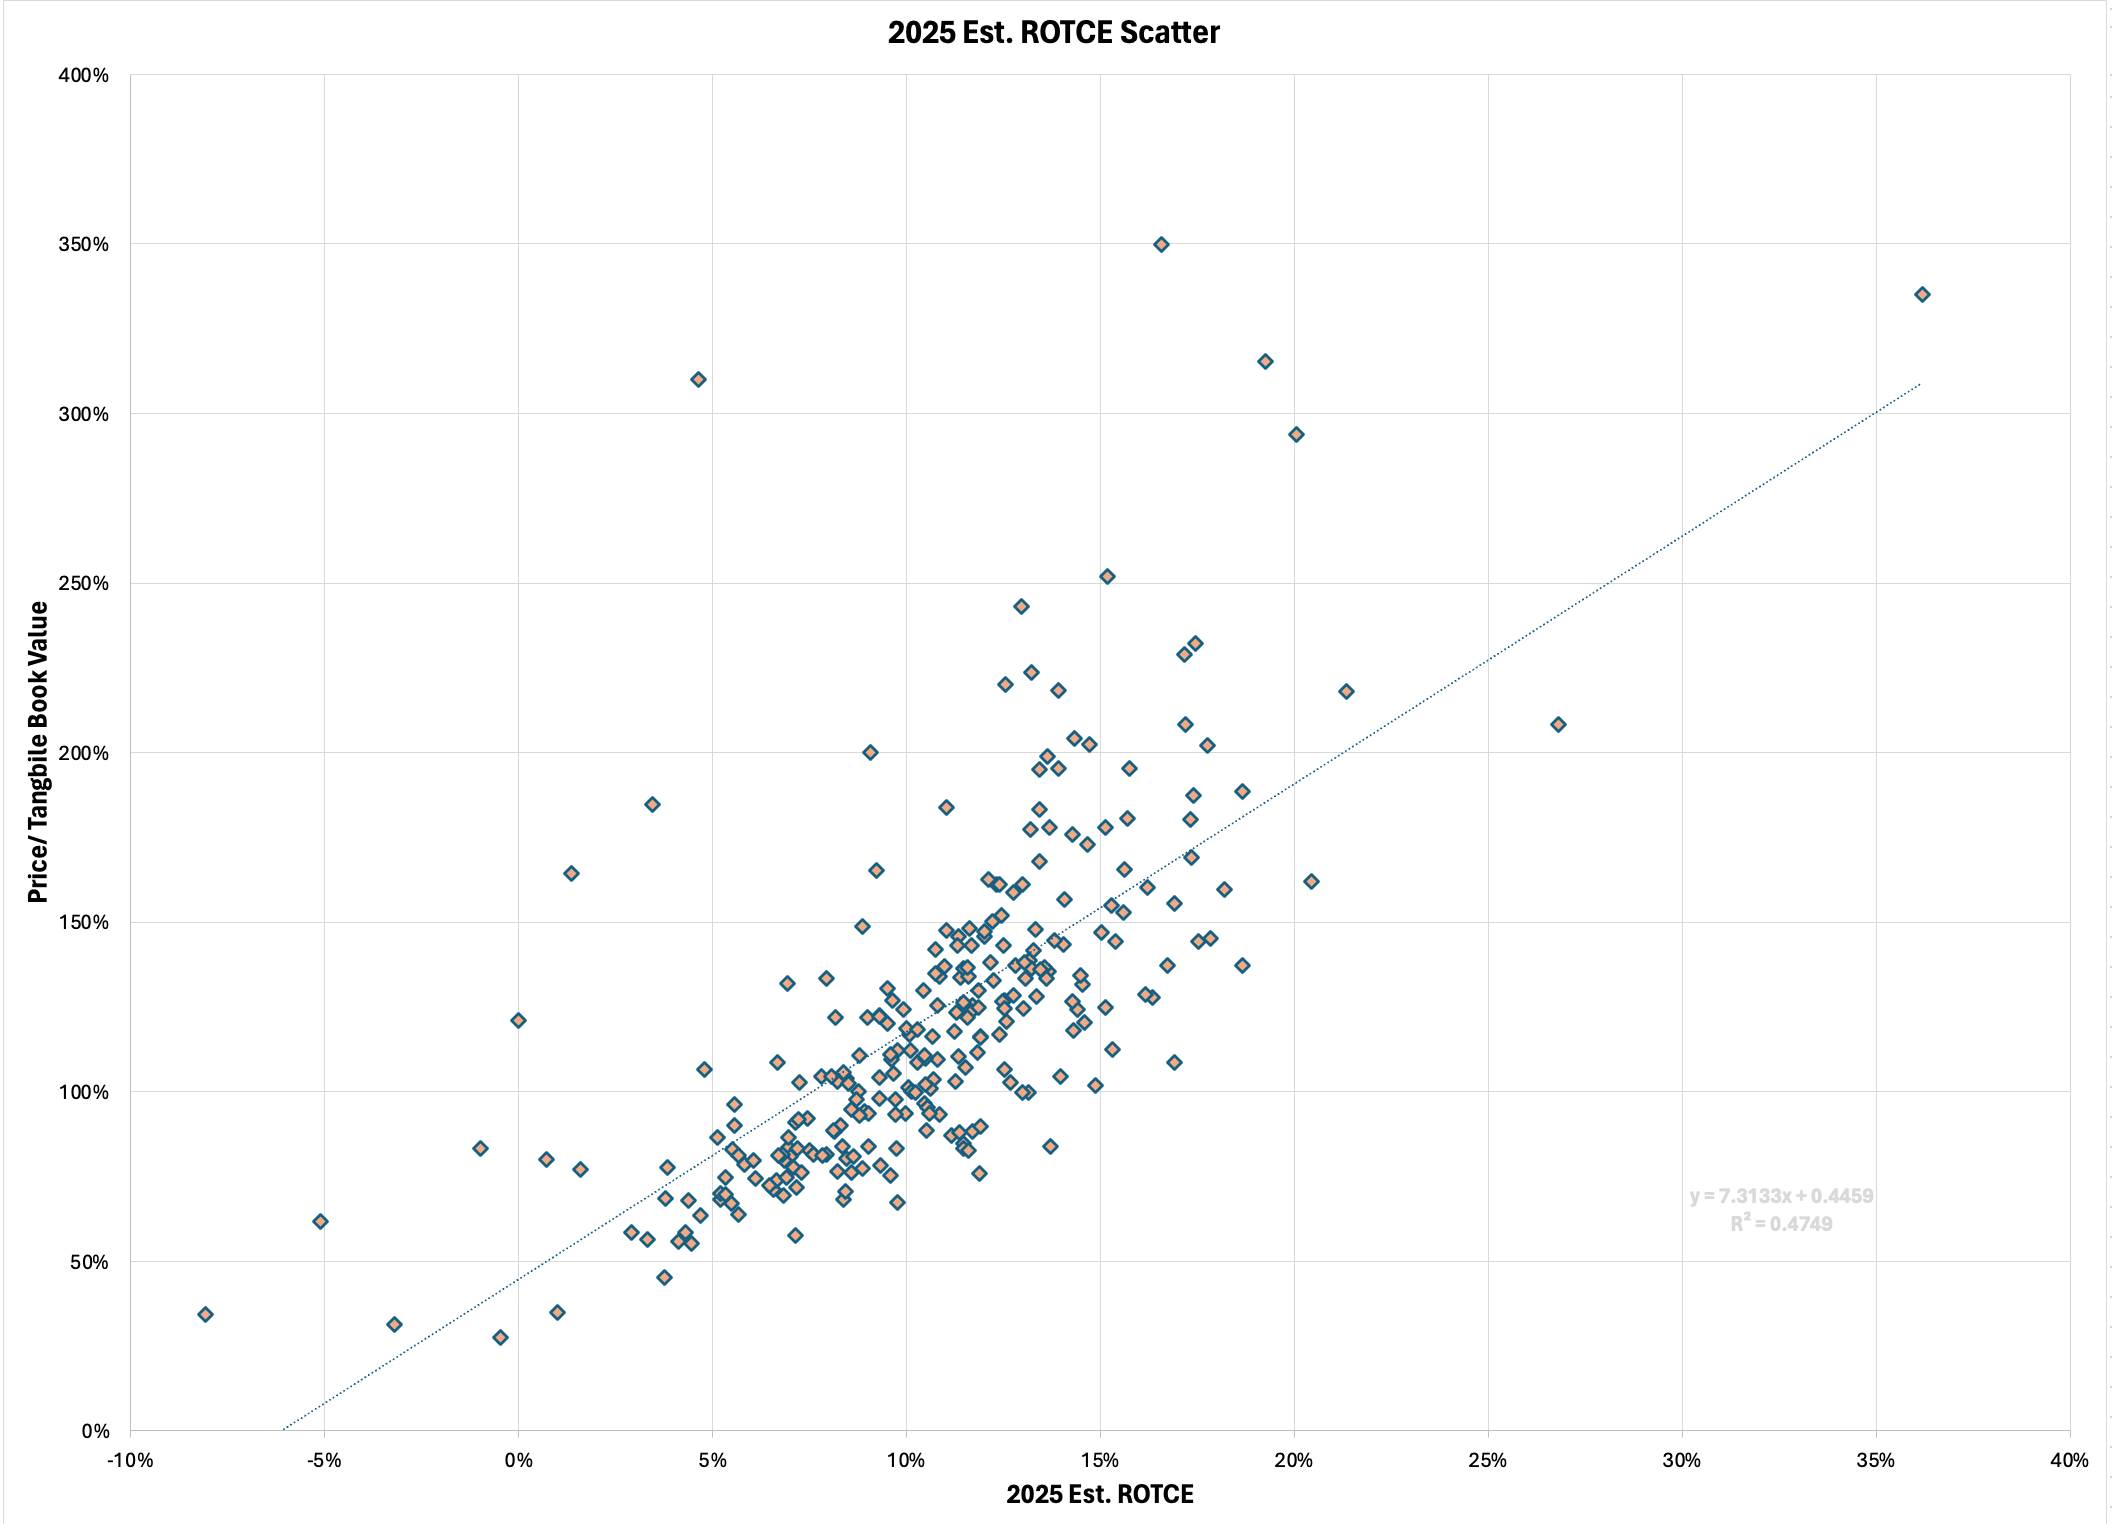
Key Takeaways from the Scatter:
First of all, this highlights how few high-flyers there are in banking. This has been a tough environment for banks in general, but it should jump out at you just how few banks produce ROTCEs north of 20%. Banking is not a high return business, it is a “how long can I produce above average returns without blowing up” business.
Second of all, high valuations are not the norm. At best and given a pretty wide band, most banks are priced in the 75% to 150% of TBV. Keep in mind this includes large, medium, and small cap banks and small caps are trading substantially cheap to larger more liquid names. But it’s hard for someone to escape the gravity of high regulations and limited options to grow earnings.
The last thing that should jump out at you is that there is a large clustering of banks returning between 5% and 15% on TCE. This is the fat part of the bell curve for banks in this environment (and honestly in most historical environments also). Much has been made of the consolidation in the industry (and it’s real) but most people talking about this don’t realize that the main source of attrition relative to other industries is the lack of new banks being created.
Afterall, why go through a lot of headaches to pump out a 12% ROTCE when the SPY does 10% or so annually and it feels like NVDA does that monthly?
Valuations As a Tell.
Why should a bank with a 15% ROTCE trade at 250% of TBV while another with a 15% ROTCE trade at 100% of TBV?
Often times it has to do with fundamentals.
All things equal, a bank with the same ROTCE and a lower valuation should carry more risk: interest rate, credit, liquidity, etc.
Other times the bank with the higher valuation may have lower risk, but also may have a better track record of results (Growth Score).
And that is where the fun of bank investing begins because even though both companies are literally “banks”, their business model, balance sheet, shareholder base, and future return profile could be completely different. They could have different exposures to credit, different funding mixes, different non-interest income profiles, and the list goes on.
The entire game in bank investing is learning how to figure out which ROTCE profile is off relative to what the market thinks. Kind of simplistic. But at the core that’s it.
Growth Ranking + Trend Difference:
As we shift onto the individual names, you’ll notice I added a “Growth Ranking” score because I wanted to know who has a track record of growing the most important metrics over time. You can look back through my writings to brush up, but the growth ranking is effectively a means to answer who has grown EPS, Revenue per Share, & TBV per share over the last 7 years above their peers. Higher growth rates in these metrics tend to produce superior stock performance and rather than listen to a management team tell me how great they are, I tend to use this Growth Ranking.
And then the last bit of set up before digging into the list is the above/below trend differential. The main purpose being to show who is trading above the correlation trend implied valuation & by how much.
Themes That Should Win Going Forward:
Bias towards lower loan to deposit ratios over high loan to deposit ratios
Bias towards higher Cost of Funds Banks than lower (more room for NIM expansion with rate cuts)
Bias towards higher CET1 & RBC given regulatory & ratings agency scrutiny on capital levels
Bias away from low growth banks at modest discounts versus growth banks at modest premiums (over the longest-term better growth scores will win as a theme)
Individual Names, Growth Rankings, ROTCE, Valuations, & Trend Differential:
Keep reading with a 7-day free trial
Subscribe to Victaurs to keep reading this post and get 7 days of free access to the full post archives.